Monitoring labels
PMM uses labels (key/value pairs) to tag the monitoring data it collects. Labels appear in both Prometheus metrics and Query Analytics (QAN), so you can use them to filter, group, and create alert rules across your entire infrastructure.
Where labels appear in PMM
Labels are available as filters in dashboards, Query Analytics, and the Explore section.
On dashboards, labels appear as variable dropdowns at the top of the page. Use them to filter the metrics displayed, for example, to show only a specific environment, cluster, or service type.
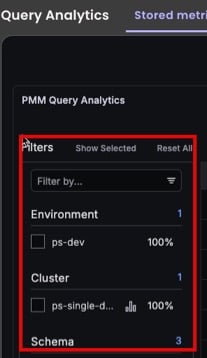
In Query Analytics, labels appear as filter groups in the Filters panel on the left. Use them to narrow query data by environment, cluster, service, node, and more.
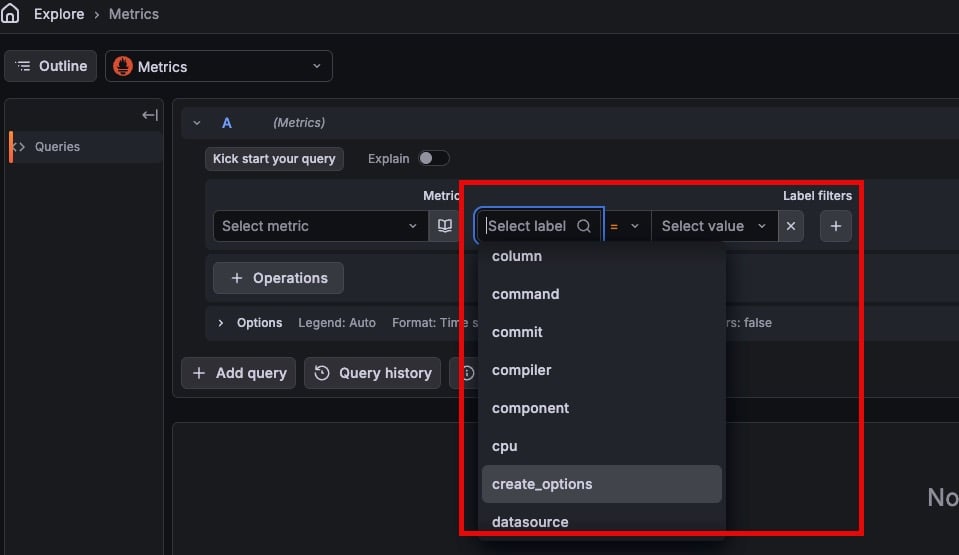
In Explore > PromQL builder, labels appear as Label filters next to the metric selector. Select a label and value to narrow the metric results to a specific service or node.
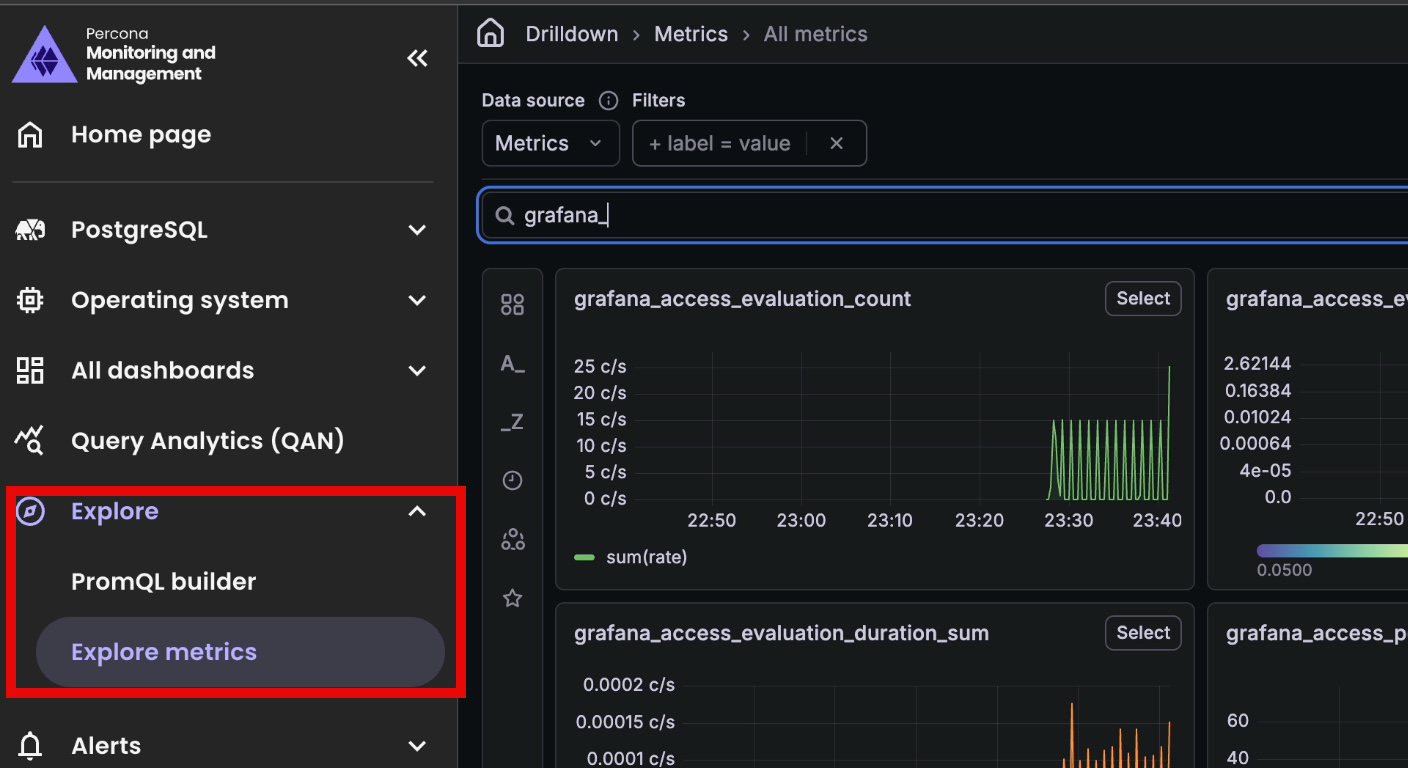
If you prefer to browse metrics without writing queries, you can also enable the Explore metrics plugin. Once enabled, it appears under Explore in the left sidebar and supports the same label-based filtering. See Enable Explore metrics.
Label types
PMM supports two types of labels:
Standard labels are automatically assigned by PMM based on detected characteristics of the monitored object. Required standard labels are created when you add a Node, Service, or Agent.
Those records cannot be created without them. Optional standard labels are populated when PMM can detect the value. You can set an initial value for a standard label when adding a service, but PMM may update it automatically if it detects a change.
| Label | Applies to | Required | Modifiable |
|---|---|---|---|
node_id |
Node | Yes | No |
node_name |
Node | Yes | No |
node_type |
Node | Yes | No |
machine_id |
Node | No | No |
node_model |
Node | No | No |
az |
Node | No | No |
region |
Node | No | No |
container_name |
Node | No | No |
container_id |
Node | No | No |
service_id |
Service | Yes | No |
service_type |
Service | Yes | No |
service_name |
Service | Yes | No |
environment |
Service | No | Yes |
cluster |
Service | No | Yes |
replication_set |
Service | No | Yes |
external_group |
Service | No | Yes |
agent_id |
Agent | Yes | No |
agent_type |
Agent | Yes | No |
For labels where Modifiable is No, remove the service and re-add it with the correct values.
Custom labels are defined and managed by you. Use them to organize your infrastructure by team, application, owner, or any other attribute that matters to your organization. PMM never overwrites custom labels.
Custom labels can hold any value you choose. When naming custom labels:
- Use letters, numbers, and underscores only. Dashes are not allowed.
- A label name can start with a single underscore (
_). - A label name cannot start with double underscores (
__), which are reserved by Prometheus.
Custom labels can be updated at any time via the PMM UI or the API.
Note
When PMM writes metrics, it merges standard and custom labels. If a custom label has the same name as a standard label, the custom label takes precedence.
Set labels
Set labels when adding a service with pmm-admin:
# Set standard labels
pmm-admin add mysql --replication-set=MySet1 --environment=production ...

# Set custom labels
pmm-admin add mysql --custom-labels="owner=joe,team=backend" ...
You can also set labels through the PMM UI when adding a service under Inventory > Add Service, or via the PMM API.
To view labels on existing services, go to Inventory > Services in the PMM UI and expand the Details section on the Options column.
Modify labels
You can update the following standard labels after a service is created, without removing and re-adding it:
environmentclusterreplication_set
For all other standard labels, remove the service and re-add it with the correct values. Custom labels can be updated at any time via the PMM UI or the API.