MongoDB Cluster Summary
This dashboard gives you a unified view of your MongoDB sharded cluster, covering topology, query load, chunk distribution, replication health, and resource usage across config servers, mongos routers, and all shards. Use it as your starting point when investigating cluster-wide performance or confirming the cluster is balanced and healthy.
For mongos-specific monitoring, see the MongoDB Router Summary dashboard.
Current Topology
Config Servers
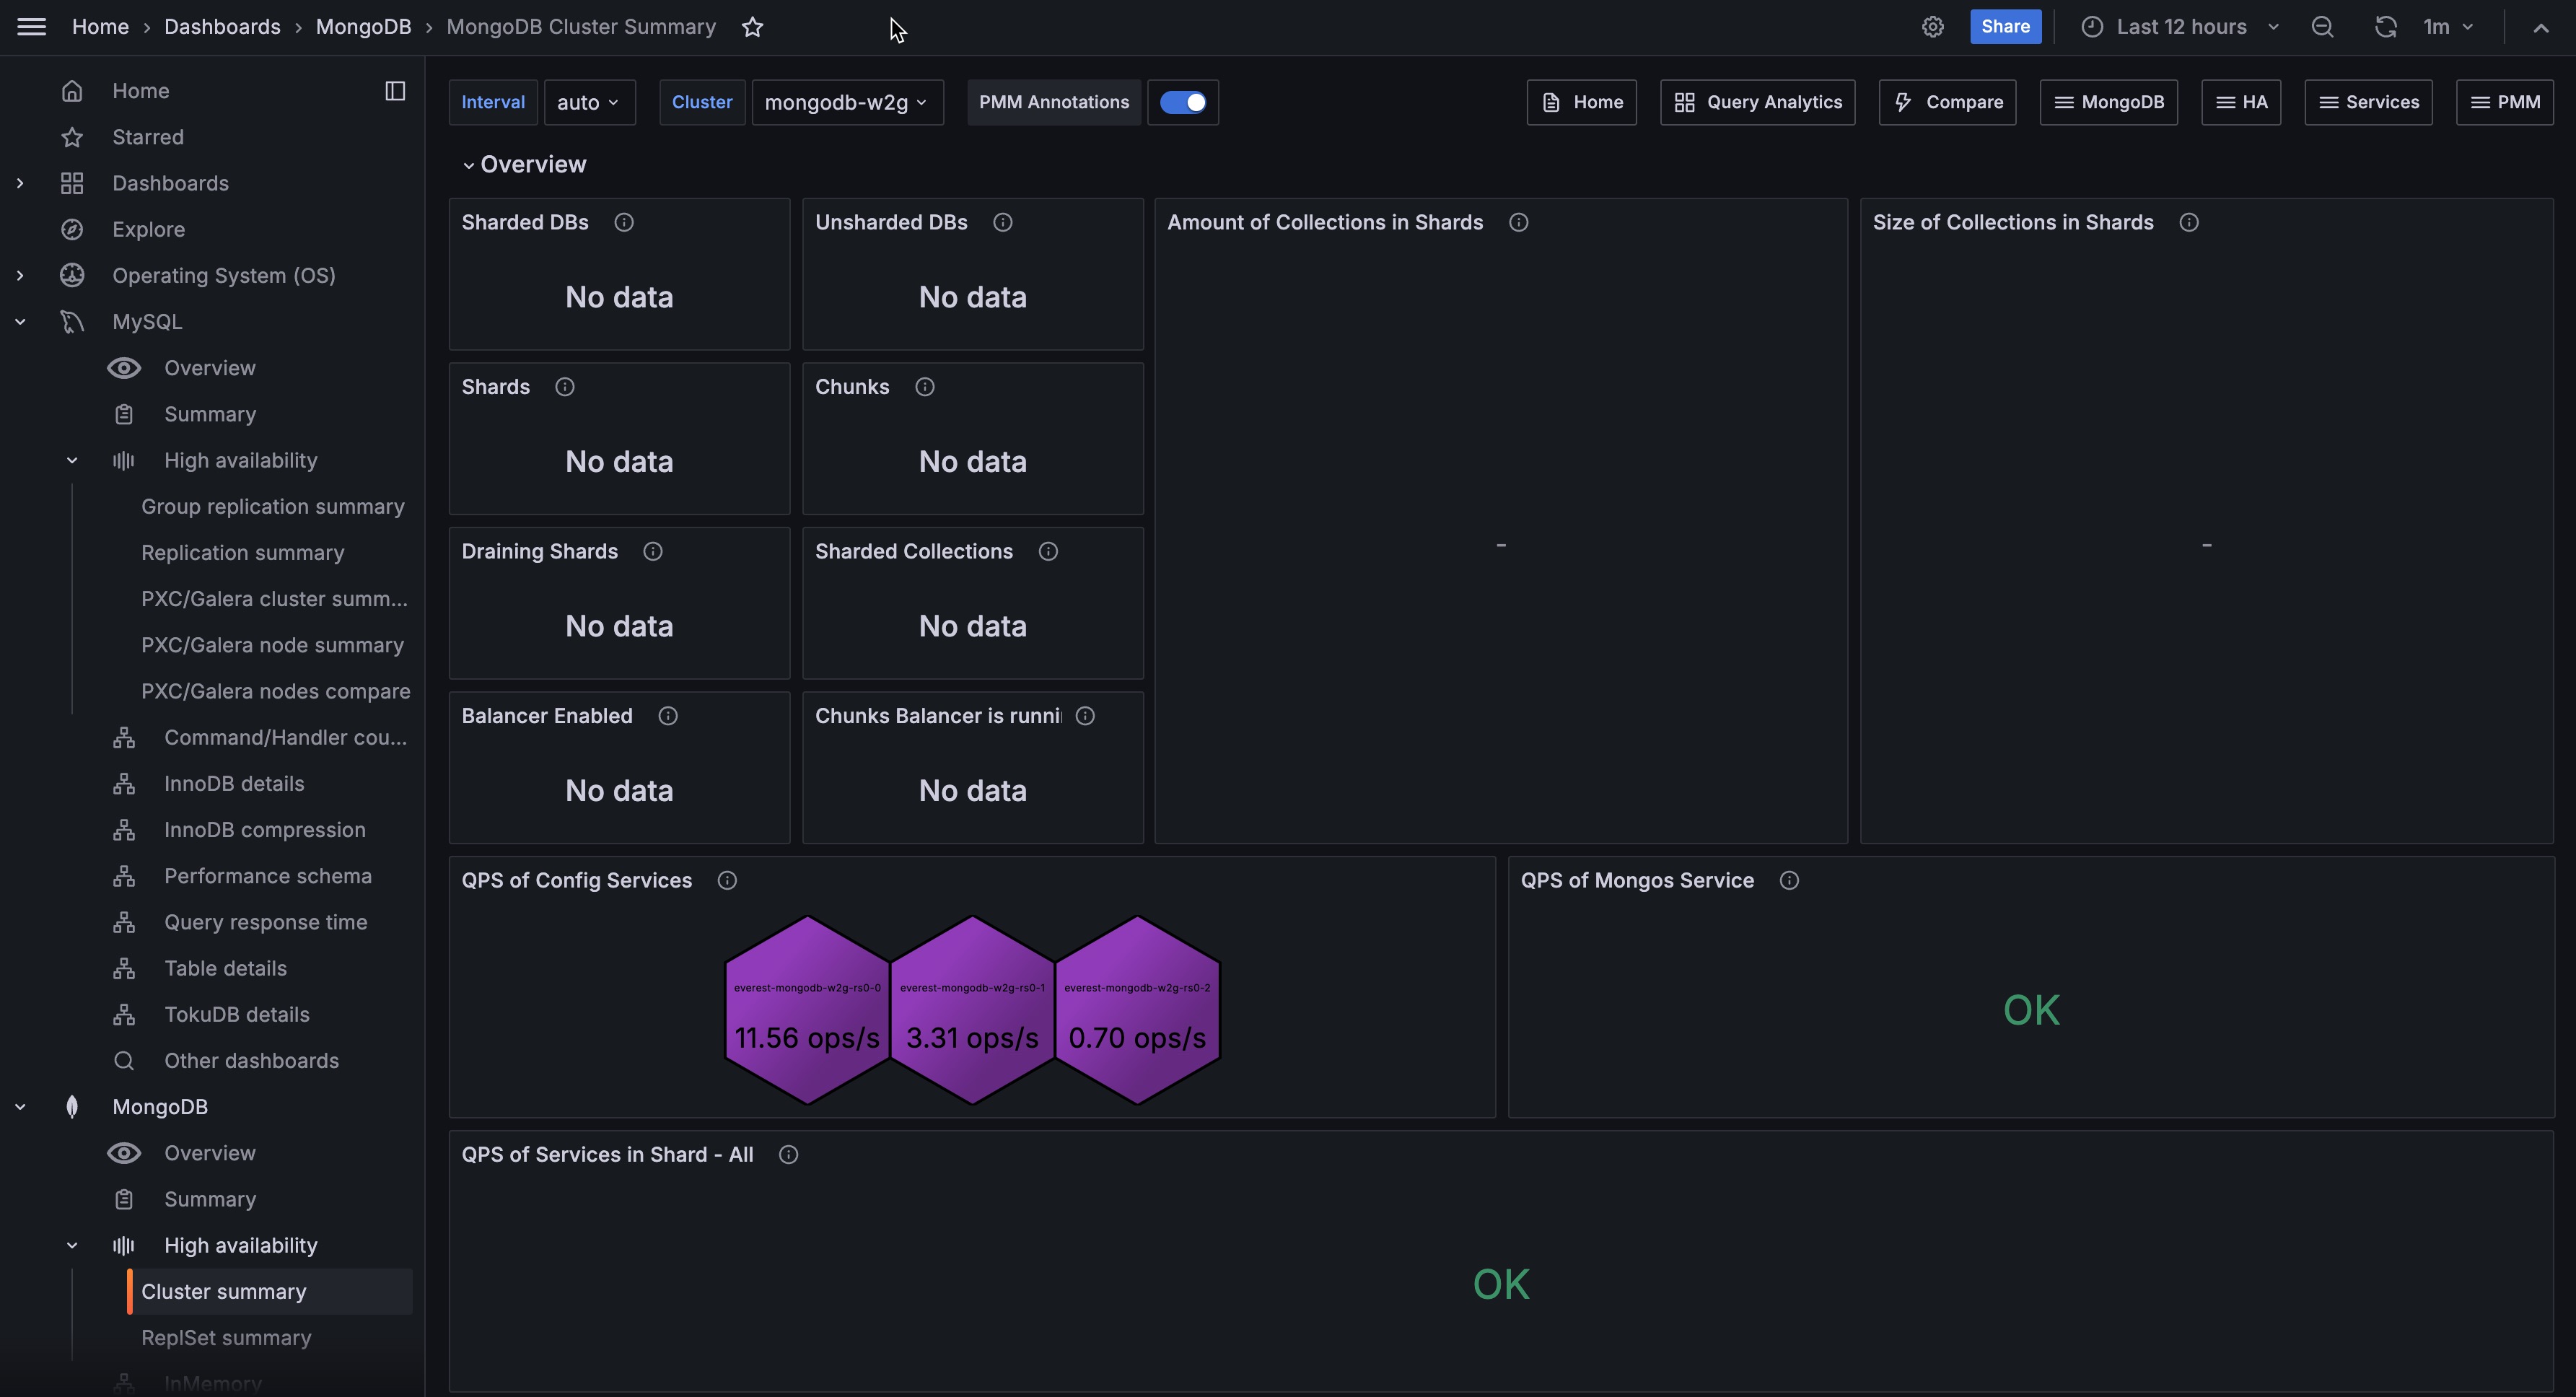
A hexagon grid showing the current status of each config server. Green means UP, red means DOWN.
Config servers run as a replica set (typically 3 nodes) and store the cluster’s metadata and chunk mappings. One red hexagon means reduced redundancy but the cluster is still operational. Two or more red hexagons in a 3-node config server set means quorum is lost and the cluster can no longer route queries or perform metadata operations. This panel shows UP/DOWN status only, not which node is the primary.
Mongos Routers
A hexagon grid showing the current status of each mongos router. Green means UP, red means DOWN.
Shards
A hexagon grid per shard, showing the status of each replica set member. Green means PRIMARY or SECONDARY and reachable. Red means the node is unreachable or in an error state.
Use these grids to confirm all cluster components are healthy before investigating performance metrics.
Configuration for correct topology display
To ensure each component appears in the correct section when adding MongoDB services with pmm-admin add mongodb or via the PMM UI:
- use the same
--clustername for all components of your sharded cluster. - add config servers, shard nodes, and mongos routers as separate services.
For details, see Add MongoDB services via CLI.
Example:
pmm-admin add mongodb --username=pmm --password=password \
  --service-name=rs-0-1 --replication-set=shard0 \
  --host=127.0.0.1 --port=27018 --cluster=myMongoCluster
Overview
QPS of Services
Shows the current query rate per second for each replica set in the cluster, excluding commands. Use this to quickly see which shards are carrying the most query load and spot any that stand out.
Feature Compatibility Version
Shows the Feature Compatibility Version (FCV) currently active in the cluster. The FCV controls which MongoDB features are available and determines the data file format. Check this after upgrades to confirm the FCV has been updated as expected. An FCV that lags the binary version means some new features are not yet enabled.
Shards
Shows the total number of shards in the cluster.
Mongos
Shows the number of mongos routers registered in the cluster.
Draining Shards
Shows how many shards are currently being drained via removeShard. A non-zero value means the balancer is actively moving chunks off a shard being removed. Watch this alongside Chunks Move Events to track progress.
DBs
Shows the number of user-created databases in the cluster. Watch this over time to track database growth.
Balancer Enabled
Shows whether the cluster balancer is currently enabled. YES means the balancer is active and will redistribute chunks when shards become unbalanced. NO means balancing is paused, which may cause chunk distribution to drift over time. Investigate if the balancer is unexpectedly disabled.
Total data size
Shows how much storage your sharded cluster is currently using for data and indexes
across all shard primaries. System databases (admin, local, config) and config server metadata are excluded.
Check this panel regularly to understand your cluster’s total storage footprint. Compare it with the Data distribution panel to see whether data is growing evenly across shards or concentrating on specific ones. Use the trend in Data size over time to decide when to add shards or storage capacity.
This panel requires the dbstats collector on the MongoDB exporter on each shard mongod node. To enable it, see Add database services.
Data size over time
Shows how your cluster’s total data and index size changes over the selected time range. Use this to spot growth trends, identify unexpected spikes, and plan when you will need to scale storage or add shards. A sudden increase may indicate a bulk data load, a missing TTL index, or uneven shard growth that needs investigation.
Shows the total logical data size (uncompressed data plus indexes) summed across all shard primaries in the cluster. System databases (admin, local, and config) are excluded. Config server metadata is not included in this total.
Use this metric to monitor overall data growth for the sharded cluster, similar to the cluster data size view in Ops Manager. The Data Size Over Time graph shows the same total over the selected time range.
This panel requires the MongoDB exporter dbstats collector on shard mongod nodes. Enable it by turning on Enable all collectors for the MongoDB service in PMM (or ensure dbstats is not listed under disabled collectors).
Chunks distribution
Shows the total number of chunks across all shards. A sudden increase may indicate rapid data growth or a change in sharding key selectivity.
Last Election
Shows how long ago the most recent primary election occurred in the cluster. A very recent election may indicate an unexpected failover or replica set instability. Click to open the MongoDB ReplSet Summary for more context.
Data distribution
Shows the total storage size of user-created collections per shard in bytes.
A balanced cluster should show roughly equal bars across shards. Large differences between shards indicate data is not evenly distributed, which can cause some shards to become storage or query hotspots.
Command Operations
Shows operation rates per second broken down by type: query, insert, update, delete, getmore, replicated write operations, and TTL index document deletions. Use this to understand the overall workload mix. A spike in any operation type helps correlate with latency changes in Operations Latencies.
Top Hottest Collections by Read
Shows the five collections with the highest read rates, in operations per second using a stable rate window. The bar gauge keeps collection names visible. Use this to identify collections that may need index tuning or caching improvements.
Operations Latencies
Shows average operation latency in microseconds over time, broken down by reads, writes, and commands. Rising latency on one operation type while others remain stable usually points to a query or index problem specific to that operation type.
Top Hottest Collections by Write
Shows the five collections with the highest write rates, in operations per second using a stable rate window. The bar gauge keeps collection names visible. Use this to identify collections that may be driving lock contention or replication lag.
Operations Per Shard
Shows total operations per second for each shard as a stacked area chart, combining all operation types. Use this to see how query load is distributed across shards and whether any shard is taking a disproportionate share of the work.
MongoDB Versions
Shows the MongoDB version running on each service in the cluster. Check this after upgrades to confirm all nodes are on the expected version. Mixed versions in a cluster can indicate a rolling upgrade is in progress or stalled.
Node States
All Node States
Shows the PRIMARY, SECONDARY, ARBITER, or other state of each node in a replica set over time as a state timeline. One timeline is shown per replica set. Use this to identify when role changes happened and whether any node has been in an unexpected state for an extended period.
Fragmentation Analysis
Shows the estimated fragmentation percentage for each collection, broken down by shard. The value is calculated as the ratio of free (unused) storage to total allocated storage, and the table is sorted from most to least fragmented. Only the top 100 collections are shown; admin and config databases are excluded.
Fragmentation builds up when documents are deleted or moved, leaving gaps in storage blocks that MongoDB has not yet reclaimed. A value of 30% means roughly 30% of that collection’s allocated space is wasted.
Use this table to identify collections worth compacting — run compact on the affected nodes during a maintenance window to reclaim disk space.
Connections
Current Connections Per Shard
Shows the number of incoming connections per shard over time as a stacked area chart. Use this to spot shards that are receiving significantly more connections than others, which can indicate uneven client routing.
Available Connections
Shows the number of remaining available connections per service over time. When available connections approach zero for a service, that service is near its connection limit and new client connections will be rejected. Use this to plan connection pool sizing and scaling.
Collection Details
Number of Collections in Shards
Shows the number of collections per database in each shard, excluding system databases. Use this to verify collections are distributed as expected across shards.
Size of Collections in Shards
Shows the storage size of collections per shard, excluding system databases. Use this to identify which collections are consuming the most storage and whether data is evenly distributed.
Fragmentation Analysis
Shows the fragmentation ratio for collections across shards. A high fragmentation value means a collection has significant wasted space from deleted or moved documents. Use this to identify collections that would benefit from a compact operation.
Count of Documents in Shards
Shows the number of documents per collection across shards. Use this alongside Size of Collections to detect unusually large average document sizes or collections growing faster than expected.
Chunks in Shards
Chunk distribution
Shows the percentage of total chunks held by each shard as a bar chart. Use this to confirm chunk distribution matches your expected layout.
With standard sharding, chunks should spread roughly evenly, but zoned sharding intentionally concentrates chunks on specific shards. If distribution looks uneven and you are not using zones, check whether the balancer is enabled and running.
Amount of Chunks in Shards
Shows the number of chunks per shard as a bar chart and table. Use this alongside Chunk distribution in the Overview to confirm the balancer is keeping chunks evenly spread.
Dynamic of Chunks
Shows the rate of change in chunks per shard over time. Positive values mean chunks are being added to a shard. Negative values mean chunks are being moved away. Elevated activity here indicates the balancer is actively rebalancing data.
Chunks Move Events
Shows the rate of chunk migrations between shards over time. Sustained high migration rates can consume network and disk I/O on the affected shards and increase replication lag. Investigate if chunk moves are frequent during peak traffic hours.
Chunk Split Events
Shows the rate at which chunks are being split over time. Splits happen automatically when a chunk grows beyond the configured maximum size. A high split rate indicates rapid data growth or a sharding key with low cardinality that is causing hotspots.
Replication
Replication Lag by Shard
Shows the maximum replication lag across replica set members for each shard over time. Any shard with consistently rising lag may be under disk or CPU pressure on its secondaries, or the primary may be generating more write traffic than the secondaries can keep up with.
Oplog Range by Shard
Shows the time span covered by the oplog for each shard, representing the effective recovery window. If the oplog range is shorter than your backup window, a secondary that falls behind cannot be recovered to a consistent point in time without a full resync. A shrinking range means the oplog is rolling over faster than expected. Increase the oplog size if this occurs.
Flow Control
Shows the flow control throttle rate per shard over time. Flow control is a mechanism MongoDB uses to keep replica set lag below a configurable threshold by slowing write operations on the primary. A non-zero throttle rate means the primary is being intentionally slowed to allow secondaries to catch up. Persistent flow control activity is a signal that secondaries are struggling to keep pace with the primary.
Oplog GB/Hour
Shows the average gigabytes of oplog data generated per hour by the primary for each shard. Use this to validate oplog sizing. If this value is high relative to your configured oplog size, the recovery window in Oplog Range by Shard will shrink quickly. A rising trend means write activity is increasing.
Nodes Summary
Nodes Overview
A table listing all nodes across the cluster with their current status and key metrics, including replication state, uptime, and version.
Use this to get a per-node health snapshot without navigating to individual dashboards. Click a node name to open its Node Summary dashboard.