Percona Monitoring and Management 3.3.0
| Release date | July 9th, 2025 |
|---|---|
| Installation | Installing Percona Monitoring and Management |
| Upgrade | Migrate PMM 2 to PMM 3 |
Percona Monitoring and Management (PMM) is an open source database monitoring, management, and observability solution for MySQL, PostgreSQL, and MongoDB. PMM empowers you to:
- monitor the health and performance of your database systems
- identify patterns and trends in database behavior
- diagnose and resolve issues faster with actionable insights
- manage databases across on-premises, cloud, and hybrid environments
Release summary
This release delivers advanced PostgreSQL monitoring with five new dashboards and replication support, resolves MongoDB connection pool issues with the new mongolog query source, and adds label-based access control to Query Analytics to meet enterprise security needs.
It’s also removing support for Ubuntu 20.04 LTS following its end-of-life, and includes numerous bug fixes and performance improvements to enhance overall stability.
Release highlights
Enhanced PostgreSQL monitoring with replication support
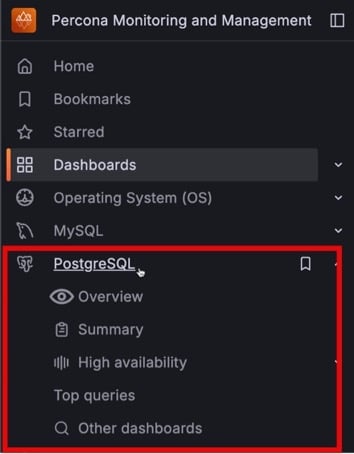
PMM 3.3.0 transforms PostgreSQL monitoring with enhanced existing dashboards, five new production-ready dashboards, replication monitoring and a redesigned menu structure for easier navigation.
New PostgreSQL dashboards:
- Replication Overview: tracks replication lag and reveals primary-replica relationships in real-time
- Top Queries: identifies performance bottlenecks with advanced query analysis and customizable time-based filtering
- Checkpoints, Buffers and WAL Usage: monitors checkpoint performance and correlates I/O usage patterns
- Instances Overview Extended: delivers deep-dive performance analytics with advanced PostgreSQL metrics
- PostgreSQL Patroni Details: monitors high-availability PostgreSQL clusters with cluster member status, replication health, and failover monitoring (promoted from experimental status)
Enhanced PostgreSQL dashboards:
- Instance Summary: updated with wraparound metrics and top 10 database size analysis
- PostgreSQL Instances Overview: improved organization and additional metrics
New capabilities:
- Transaction ID wraparound prevention with with wraparound metrics
- Custom metric collection for monitoring beyond standard PostgreSQL statistics
- Better dashboard grouping to quickly spot issues across your PostgreSQL infrastructure
- New organized left menu structure with dedicated High Availability (HA) section
Label-based access control for Query Analytics
Query Analytics (QAN) now supports label-based access control (LBAC). This allows admins to associate label visibility with a role limiting visibility into query data. Users see only the databases and services permitted by their roles, with filter options automatically restricted based on assigned labels.
This makes it easy to limit access by technology (e.g., MySQL-only), environment (e.g., production), or region, enhancing both security and clarity.
To test it, set up a PMM Server, connect MySQL and PostgreSQL databases, enable access control, and define roles using LBAC selectors.
MongoDB monitoring at scale with new log-based query source
PMM 3.3.0 introduces mongolog, a new way to collect MongoDB metrics. This feature helps prevent connection issues in large-scale environments by reading metrics directly from MongoDB log files instead of using database queries.
Traditionally, monitoring many MongoDB databases (100+) can lead to timeouts as monitoring queries compete for limited connections. mongolog avoids this by using zero database connections, delivering the same query analytics data without impacting your database’s performance.
This log-based approach reads from existing MongoDB log files (similar to MySQL’s slow query log monitoring) which may increase disk I/O. Use it as an alternative to the default profiler-based method.
In addition, mongolog provides unlimited database scalability and support for restricted environments like mongos routers where system.profile access is unavailable.
To enable mongolog, add --query-source=mongolog when registering MongoDB services. For setup instructions, see Connect MongoDB databases to PMM.
PMM 3.3.0 available on AWS Marketplace
PMM 3.3.0 is now available for deployment through the AWS Marketplace, making it easier to deploy Percona Monitoring and Management in your AWS environment. With AWS Marketplace you get:
- preconfigured AMI with optimized settings
- simple hourly pricing plus standard EC2 costs
- quick deployment with a few clicks directly from AWS Marketplace
For instructions, see Deploy PMM Server on AWS.
Platform support changes and deprecations
Removed support for Ubuntu 20.04 LTS (Focal Fossa)
Ubuntu 20.04 LTS (Focal Fossa) reached its End of Life on May 31, 2025. Consequently, we no longer build PMM Client packages for this platform.
If your PMM Client is running on Ubuntu 20.04, upgrade your operating system to Ubuntu 22.04 LTS or a later version, and then reinstall PMM Client using the package version for your new Ubuntu release.
Existing installations on Ubuntu 20.04 will continue to work but we will not release further updates. Source packages (.sdeb) are now built on Ubuntu 22.04 instead of Ubuntu 20.04.
Improvements
- PMM-13970 - Added
--tls-skip-verifyflag forpmm-admin add external,pmm-admin add external-serverless, andpmm-admin add haproxycommands. This flag skips TLS certificate validation, enabling you to monitor services with self-signed certificates or IP-based endpoints that lack proper certificate SANs, including PostgreSQL Operator deployments with HAProxy. - PMM-14000, PMM-13861, PMM-13862, PMM-13863, PMM-13864, PMM-13865, PMM-13866, PMM-13867, PMM-13868 - Enhanced PostgreSQL monitoring with five new dashboards, improved existing dashboards, custom query support for specialized metrics, and a redesigned menu structure for better navigation.
- PMM-12548 - Added
mongologquery source for MongoDB that reads slow query logs from disk, eliminating connection pool exhaustion in environments with 100+ databases. - PMM-13596 - Improved access control for PMM Dump and PMM Logs by hiding these menu options for users without appropriate permissions. Non-admin users no longer see inaccessible links in the Help menu, preventing confusing 401 error messages.
- PMM-14059 - Improved the Mongos Routers graph in the MongoDB Sharded Cluster Summary dashboard to display individual router nodes with their status in hexagon format, providing consistency with Config Servers and shard displays instead of showing only a generic OK status.
- PMM-13786 - Upgraded PMM OVF specification to OVF 2.0 format for enhanced security (SHA256 hashing), better virtual hardware support, and improved cloud compatibility.
- PMM-13821 - Upgraded Go runtime to version 1.24.x for enhanced performance. This update includes the latest CVE fixes and improvements to maintain PMM’s security.
Fixed issues
- PMM-14070 - The Top 5 Databases By Size chart was not displaying data due to an incorrect query configuration. The chart now correctly shows database size information.
- PMM-14066 - Fixed an issue where MySQL services were not collecting metrics when database passwords contained special characters (such as
#), which caused connection failures and prevented MySQL metrics from appearing in dashboards. - PMM-14047 - Fixed an issue in the MongoDB Sharded Cluster Summary dashboard where you could not select MongoDB clusters when other database types (such as Percona Server clusters) were also monitored by the same PMM instance. You can now select MongoDB sharded clusters regardless of what other database clusters are monitored by PMM.
- PMM-13794 - Fixed an issue in HA deployments where the
/v1/server/leaderHealthCheckendpoint would cause server crashes with “invalid memory address” errors. The health check endpoint now works correctly, preventing HAProxy health check failures. - PMM-13963 - Clicking the Explain tab in the Query Analytics dashboard made the PMM unresponsive for Percona Server instances. This issue is now fixed.
- PMM-13881 - The mongodb_exporter would displayed the wrong version number when queried with
--version. This issue is now fixed.
Known issues
Incorrect execution times with PostgreSQL pg_stat_monitor
When using pg_stat_monitor extension with pg_stat_monitor.pgsm_enable_query_plan enabled, Query Analytics (QAN) displays incorrect execution times that can be off by 1000x or more. For example, simple SELECT queries that should complete in milliseconds may appear to take 50,000+ seconds.
This is because enabling query plans causes pg_stat_monitor to create multiple records for each query, leading to incorrect timing calculations.
Workaround
Disable query plan collection to restore accurate timing metrics:
-- Check current setting
SHOW pg_stat_monitor.pgsm_enable_query_plan;

-- Disable query plan collection
ALTER SYSTEM SET pg_stat_monitor.pgsm_enable_query_plan = off;
SELECT pg_reload_conf();

-- Verify the change
SHOW pg_stat_monitor.pgsm_enable_query_plan;
Missing QAN examples with MySQL Performance Schema
When using MySQL Performance Schema as the query source, query examples may be missing in the QAN dashboard, showing the message “Sorry, no examples found”. This is caused by the limited size of MySQL’s in-memory history tables, which can be quickly overwritten under high query load.
Workaround
Use the slowlog query source to capture and retain full query examples. For details, see the About query analytics (QAN) topic.
Incorrect tls_skip_verify values in API responses
The /v1/inventory/agents/{agent_id} API endpoint incorrectly returns tls_skip_verify: false for external exporters, external-serverless services, and HAProxy services, even when the --tls-skip-verify flag was used when adding the service.
This is only a display issue. TLS skip verification still works correctly. To confirm, run pmm-admin status and check that the services are running and collecting metrics as expected.