Percona Monitoring and Management 3.6.0
Release date: 5 February 2026
Percona Monitoring and Management (PMM) is an open source database monitoring, management, and observability solution for MySQL, PostgreSQL, MongoDB, Valkey and Redis. PMM empowers you to:
- monitor the health and performance of your database systems
- identify patterns and trends in database behavior
- diagnose and resolve issues faster with actionable insights
- manage databases across on-premises, cloud, and hybrid environments
📋 Release summary
PMM 3.6.0 delivers a redesigned interface with native PMM navigation, High Availability Cluster (Technical Preview) for zero-downtime failover, improved MongoDB dashboards, and expanded platform support for PostgreSQL 18 on RHEL 10 and Debian 13.
This release also addresses a critical security vulnerability and includes numerous stability improvements.
✨ Release highlights
New native PMM navigation and revamped user interface
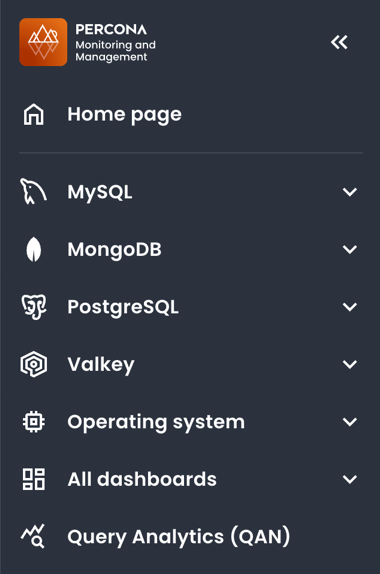
The first thing you’ll notice with this update is the new look-and-feel of the PMM interface. We’ve moved away from Grafana’s built-in menus to PMM’s own navigation, organized around PMM’s workflows to make it easier for you to move through PMM and find what you need faster.
This brings:
-
a new always-visible sidebar provides consistent access to all PMM features without relying on Grafana’s native menus:
-
selected time ranges and dashboard variables now persist when switching between dashboards
- a new theme switcher in the sidebar applies Light or Dark mode to both the PMM interface
-
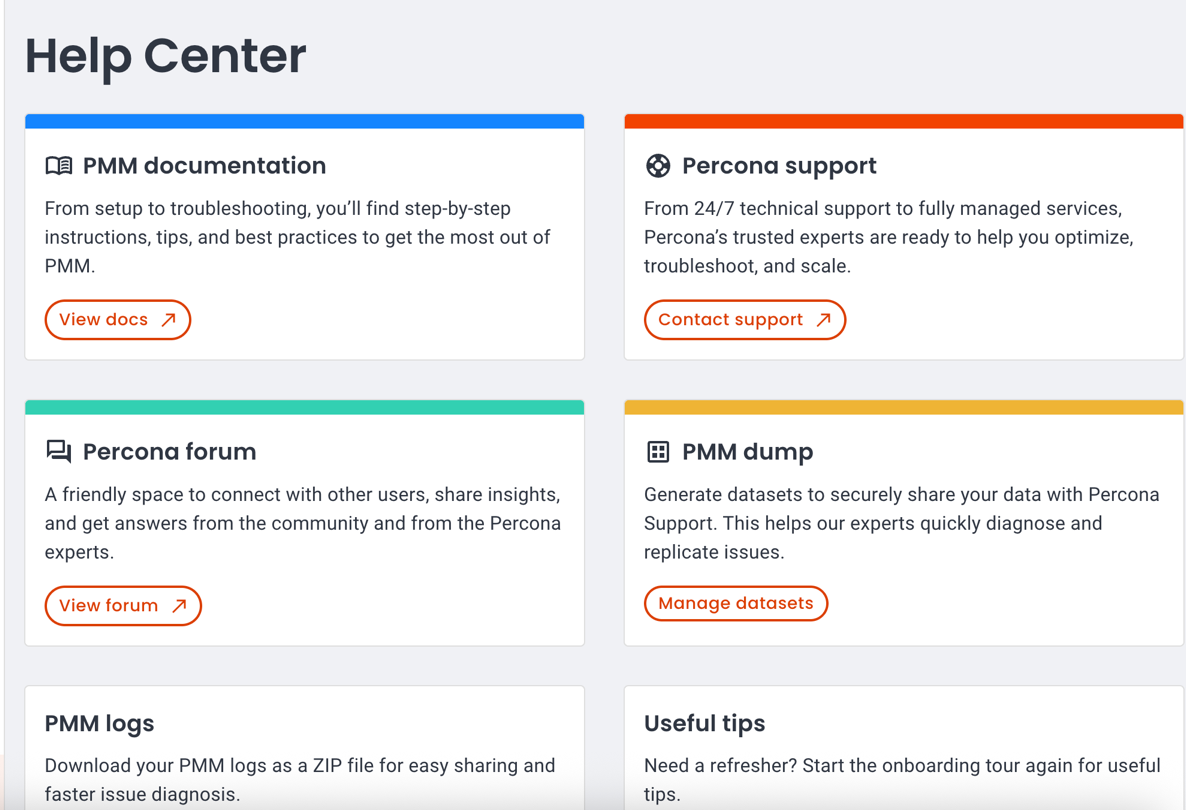
centralized Help section for quick access to documentation, community forum, support. Admin users also see Dump and Logs options:
You should know that:
- if you use a custom
grafana.inifile, you’ll need to addallow_embedding = trueto the[security]section so that the new interface can display dashboards correctly. - the new navigation is enabled by default, and you will not be able to revert to the previous Grafana-based menus.
For details on navigating the new interface, see Interface overview and Help Center.
Cluster High Availability with zero-downtime monitoring (Technical Preview)
Technical Preview status
This feature is not production-ready. Use for testing and feedback only.
PMM 3.6.0 introduces PMM High Availability Cluster, a zero-downtime HA option for continuous monitoring visibility.
PMM’s two production-ready HA options (Docker and Kubernetes single-instance) work well but during failover you lose access to dashboards and alerts for 1-5 minutes. No metrics are lost—clients cache and resend them—but monitoring visibility is interrupted.
For enterprises needing continuous visibility, we announced development of a fully cluster architecture. That architecture is now available for testing and delivers the core high availability features announced previously:
- three PMM server replicas with Raft consensus leader election
- HAProxy load balancing with automatic traffic routing
- distributed databases (ClickHouse, VictoriaMetrics, PostgreSQL) via Kubernetes operators
- Helm-based installation
- immediate failover maintaining continuous monitoring
HA status monitoring
Along with the new cluster architecture, PMM 3.6.0 enhances visibility into all HA deployments with improved monitoring capabilities.
Whether you’re using Docker HA, Kubernetes single-instance HA, or testing the new HA Cluster architecture, you can now track cluster health and status through:
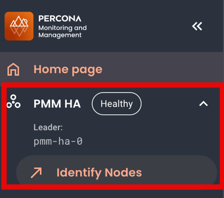
HA badge
Check the current leader node and overall cluster health at a glance using the HA badge on the side menu:
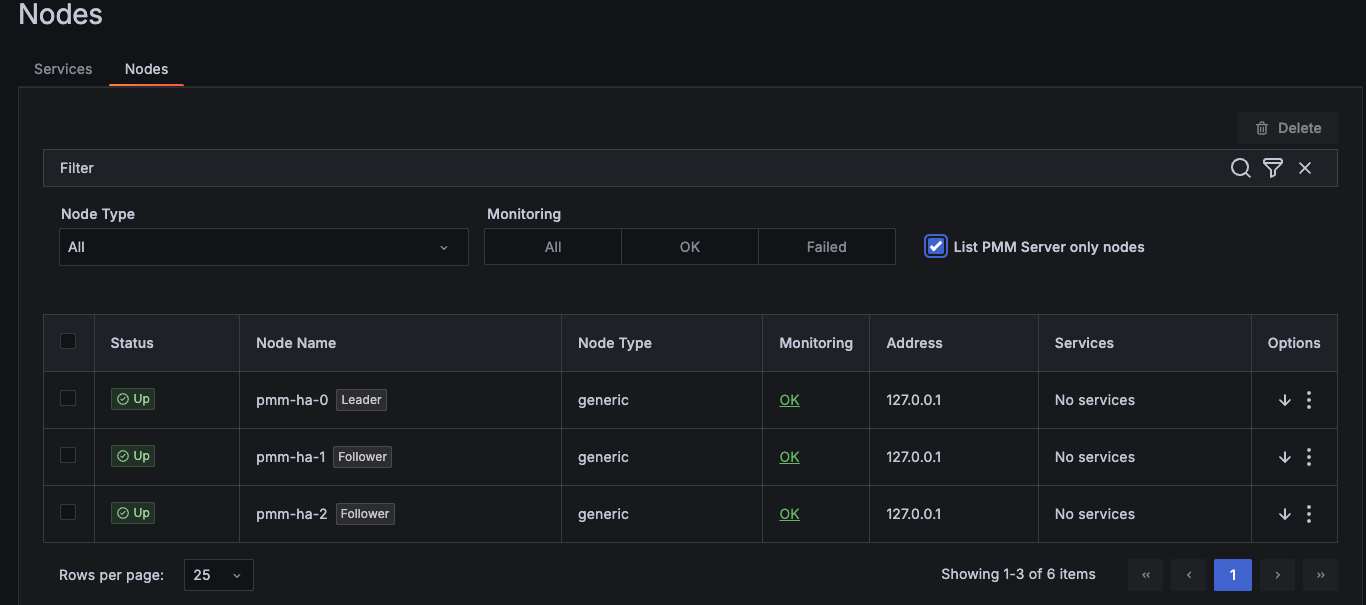
Inventory integration
View HA roles and health status for each node in your cluster under Inventory > Nodes.
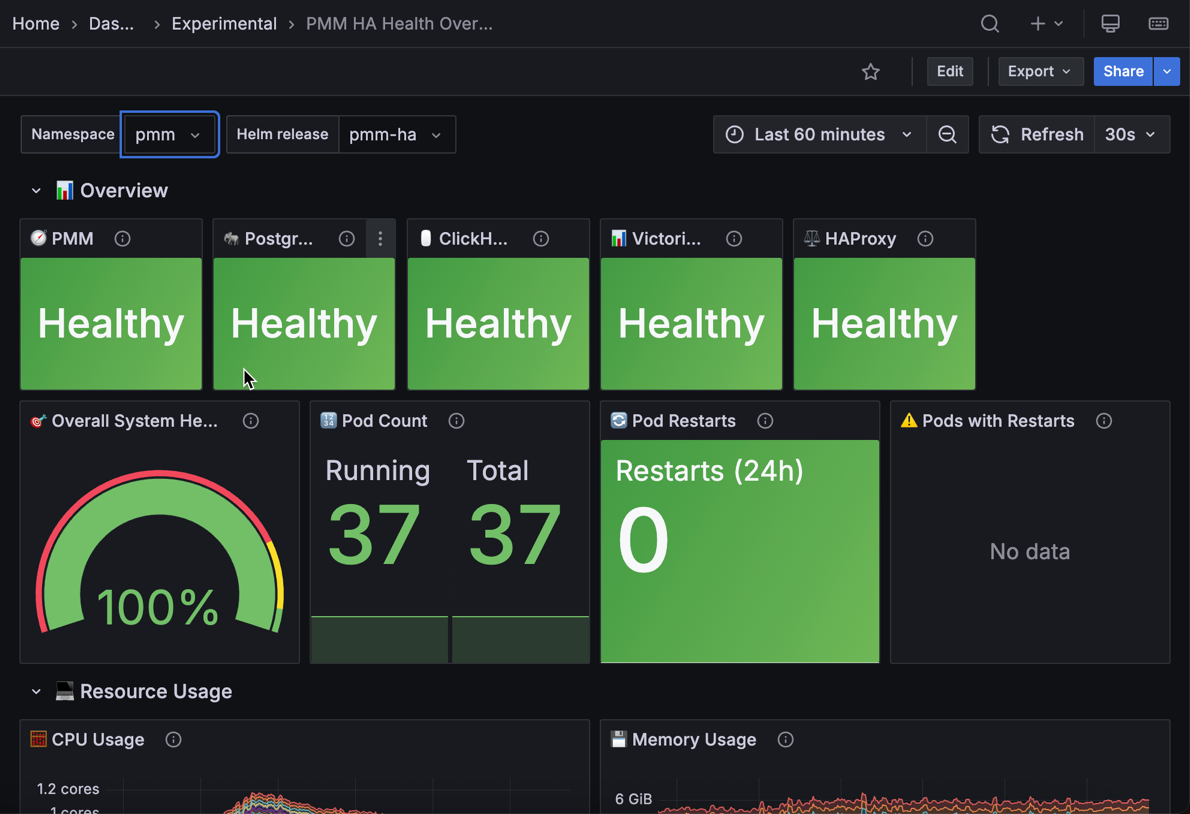
PMM HA Health Overview dashboard
Monitor component health, resource usage, and pod status for HA Cluster deployments using the HA Health Overview dashboard.
What’s still in development
This Technical Preview release focuses on core clustering functionality and zero-downtime failover. Several enterprise features are still under development and will be added in future releases as we prepare HA Cluster for production deployments.
- Production-ready stability for additional testing, performance optimization, and hardening for production workloads
See limitations and known issues for current restrictions.
Platform support
We’ve tested PMM HA Cluster on Amazon EKS with Kubernetes 1.24 and later versions. While the architecture should work on other Kubernetes platforms (GKE, AKS, on-premise Kubernetes, OpenShift), we haven’t validated these yet. VMware Tanzu is not supported.
Provide feedback
Try out this feature and share your experience on the PMM forum and JIRA Tracker, regardless of your platform.
Your feedback during this Technical Preview phase helps us prioritize improvements, expand our support matrix, and ensure the final release meets enterprise monitoring needs.
To get started with PMM HA Cluster, see Install PMM with Kubernetes HA (Clustered) and HA Cluster REST API endpoints.
MongoDB dashboard improvements
Based on community feedback, we’ve simplified several MongoDB dashboards so you can check cluster health faster and focus on the metrics that matter:
- Instances Overview: the Overview section now focuses on topology and health metrics instead of detailed resource metrics. Detailed metrics like Cursors, Latency, and Query Efficiency are now only available in Instance Summary, Replica Set Summary, and Sharded Cluster Summary.
- Instance Summary: clearer Uptime, QPS, and Latency panels with one-decimal precision. The Command Operations panel now includes additional metrics.
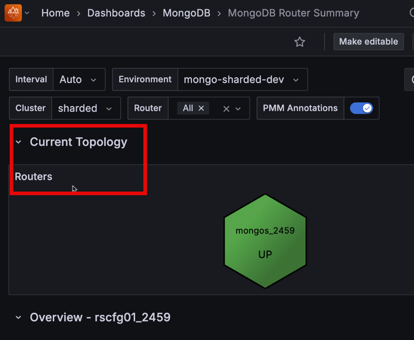
-
Router Summary: improved decimal precision across metrics. A new Routers panel at the top shows router status at a glance for quick cluster visibility:
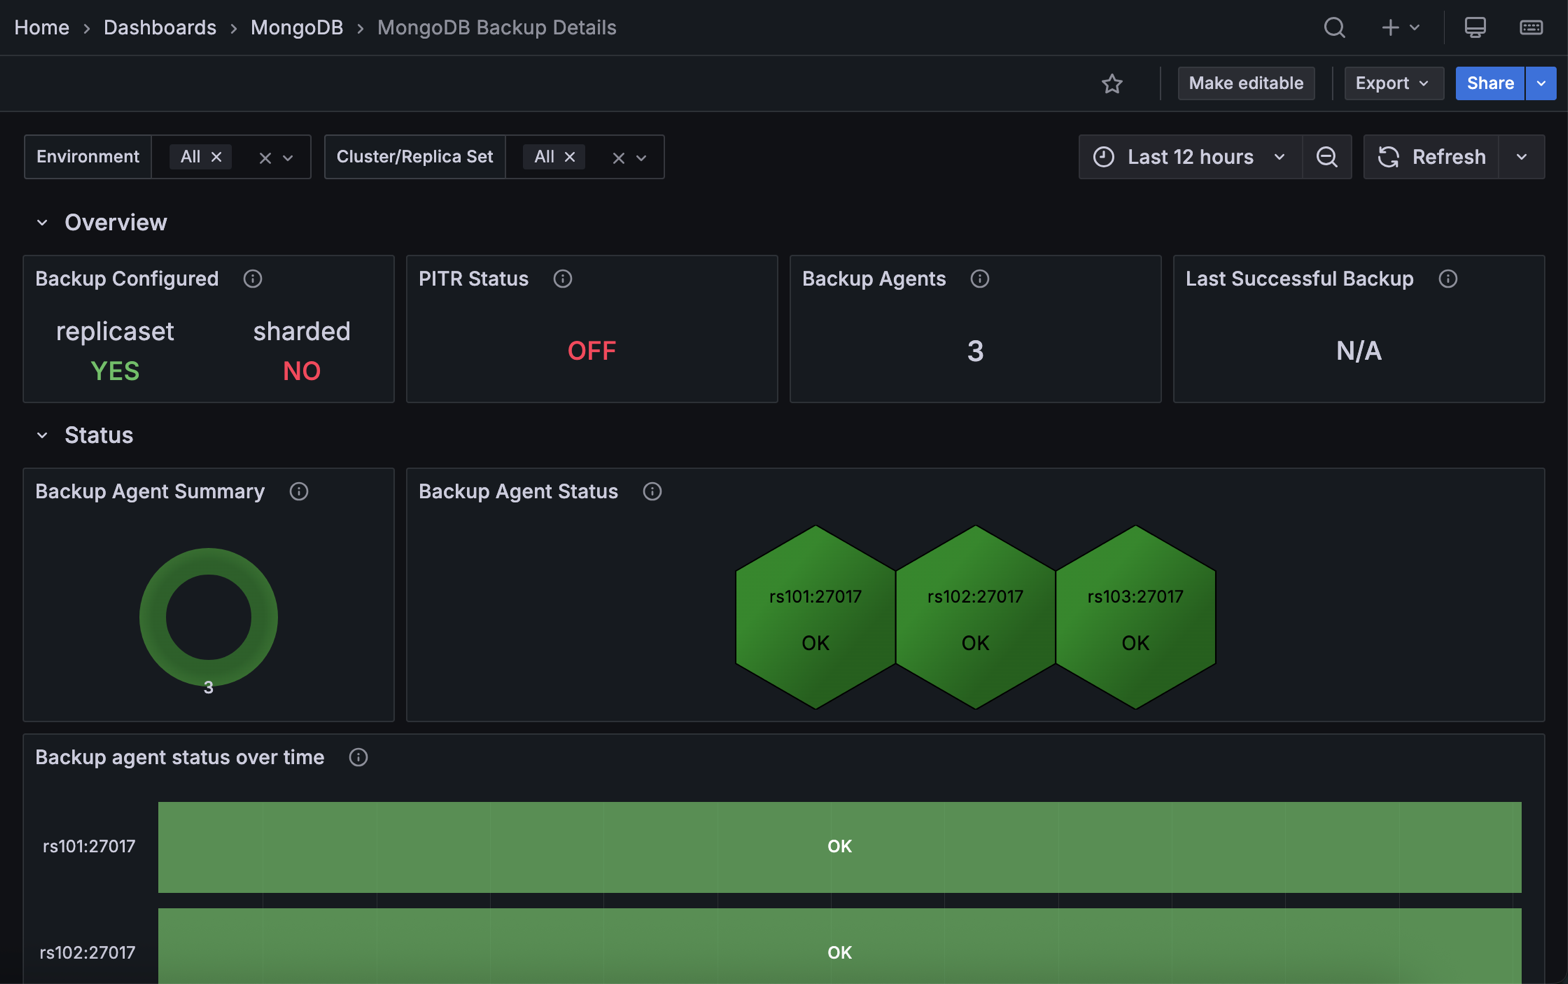
Redesigned MongoDB Backup Details dashboard
We’ve redesigned the MongoDB PBM Details dashboard with new and enhanced panels that make it easier to monitor your backup agents and track operations across your environment. You’ll find it under its new name, MongoDB Backup Details, which better reflects what the dashboard now offers.
New panels
- Backup Agents shows how many PBM agents are currently being monitored across your environment
- Backup Agent Summary displays the overall health of your backup infrastructure with a donut chart showing agent status distribution
- Backup Agent Status highlights problematic agents at a glance using a hexagon grid that identifies which specific hosts need attention
Enhanced panels
- Backup agent status over time shows how agent status has changed over your selected time range, helping you spot patterns and troubleshoot issues
- Backup history now includes new columns for Environment, Cluster/Replica Set, Size, and Duration for a complete picture of backups across your MongoDB infrastructure
To explore this dashboard, go to MongoDB > MongoDB Backup Details in the sidebar.
Added support and deprecations
PostgreSQL 18 support on RHEL 10
You can now monitor PostgreSQL 18 databases on Red Hat Enterprise Linux 10, extending the RHEL 10 support introduced in PMM 3.4.0.
To get started, install PMM Client on your AMD64 or ARM64 system.
Debian 13 support for PMM Client
PMM Client now supports Debian 13 (Trixie) so you can monitor databases on the latest Debian release (AMD64 and ARM64).
For installation instructions, see Install PMM Client with Package Manager.
VMware support removed
VMware is no longer supported as a deployment platform for PMM Server. This completes the deprecation announced in PMM 3.4.0.
This means that PMM Server OVA images for VMware are no longer provided. If you’re still running PMM on VMware, migrate to one of these supported platforms:
- Docker (recommended): simplified deployment and updates
- Podman: rootless container execution with enhanced security
- VirtualBox: familiar VM management with minimal learning curve
- Kubernetes/OpenShift: scalable container orchestration
MySQL TokuDB Details dashboard removed
The MySQL TokuDB Details dashboard has been removed as the TokuDB storage engine is no longer supported. If you were using TokuDB, consider migrating to MyRocks and use the MySQL MyRocks Details dashboard instead.
📦 Components upgrade
Nomad
Upgraded to v1.11.1 with security enhancements and new features including improved client identity management for RPC authentication, token-based client introduction, and system job deployment support. See the Nomad v1.11.1 release notes for details.
Percona Toolkit
Updated to version 3.7.1 with bug fixes for field handling in toolkit checks.
Valkey Exporter
Upgraded to version 1.80.2 with various bug fixes and improvements to metric collection and stability.
🔒 Security updates
Authenticated remote code execution vulnerability
This release fixes a critical security issue that could allow an authenticated administrator to run operating system commands on the PMM Server in certain scenarios.
The issue was caused by insecure access to internal services and has been fully addressed.
We strongly recommend upgrading to PMM 3.6.0 to ensure your deployment remains secure.
Residual security risk
As part of modern software development, complex systems commonly rely on third-party components, and some level of residual risk may remain at release time despite ongoing vulnerability management efforts. This is particularly the case when vulnerabilities in upstream dependencies are disclosed close to, or coincident with, a planned release.
The following CVEs remain present in third-party dependencies included with PMM. After assessment, the residual risk to PMM deployments is considered low due to limited exploitability, existing architectural boundaries, and available mitigating controls.
We will continue to monitor upstream disclosures and newly identified vulnerabilities, reassess their impact on PMM, and take appropriate remediation actions in future releases.
Improper Certificate Validation – CVE-2025-61729
Affected component
Grafana ClickHouse Datasource plugin (third-party dependency).
Risk assessment
Exploitation requires pre-existing host-level access sufficient to install or manipulate trusted certificates on the PMM Server host or container environment. This condition exceeds the PMM threat model, which assumes the host and container runtime are trusted.
Successful exploitation does not provide additional privileges within PMM, nor does it allow an attacker to bypass PMM authentication or authorisation controls.
Mitigating factors - PMM Server is intended to be deployed on trusted infrastructure with restricted administrative access. - PMM does not expose certificate management interfaces to unprivileged users. - The vulnerability does not affect data confidentiality or integrity in standard PMM deployments.
Risk decision
Residual risk accepted for PMM 3.6.0. This issue will be addressed through upstream dependency updates in a future release.
Excessive memory and CPU consumption – CVE-2025-61726 & CVE-2025-61728
Affected components
Underlying third-party libraries used by several PMM components.
Risk assessment
These vulnerabilities can lead to resource exhaustion (denial of service) when an attacker is able to send specially crafted requests or payloads to PMM services.
Exploitation requires network access to PMM services and the ability to deliver malformed or intentionally abusive input. These issues do not allow code execution, privilege escalation, or unauthorised access to PMM data.
Mitigating factors
- PMM is typically deployed on internal networks with restricted access.
- Containerised deployments can limit impact through CPU and memory limits.
- Authentication is required for most administrative and write operations.
Risk decision
Residual risk accepted for PMM 3.6.0. The potential impact is limited to service availability under abusive conditions. Dependency updates are planned for a future release.
Customer guidance
To further reduce exposure, Percona recommends: - Restricting network access to PMM Server to trusted networks and users - Minimising the number of PMM administrators and enforcing strong authentication - Applying resource limits to PMM Server containers where supported
📈 Improvements
-
PMM-14434: Removed the MySQL TokuDB Details dashboard, as TokuDB storage engine is no longer supported. Use the MySQL MyRocks Details dashboard instead.
-
PMM-14375: Added
--agent-env-varsflag topmm-adminadd commands. Use this to pass environment variables frompmm-agentto exporters when your monitoring setup requires environment-level credentials or configuration. -
PMM-14528: Updated Watchtower and Docker API libraries with full Docker v29.0.0 support. The
DOCKER_API_VERSIONworkaround is no longer required. If you’re using an older watchtower version and seeclient version is too olderrors, see Troubleshoot upgrade issues. -
PMM-14578: Replaced Manual HA Technical Preview with the new HA Cluster architecture, which provides automated deployment through Helm and Kubernetes operators.
-
PMM-14569 : Redesigned the MongoDB PBM Details dashboard (now MongoDB Backup Details) with new panels for monitoring backup agent health and enhanced backup history tracking.
-
PMM-14546: Upgraded Nomad from v1.10.5 to v1.11.0 with security enhancements and improved client identity management.
-
PMM-14515: Updated Percona Toolkit to version 3.7.1.
-
PMM-14517: Added PostgreSQL 18 monitoring support on RHEL 10.
-
PMM-14518: Simplified MongoDB dashboards (Instances Overview, Instance Summary, Router Summary) for faster cluster health monitoring.
-
PMM-14508: Improved Query Analytics (QAN) readability and styling in light mode.
-
PMM-14410: Various Helm chart improvements including values.yaml cleanup, ClickHouse cluster name validation, and HAProxy logic enhancements.
-
PMM-14514: Improved Valkey dashboard panel titles and tooltips for better usability.
✅ Fixed issues
-
PMM-14378: Fixed
waitid: no child processeserror that could occasionally occur when registering PMM Client (Docker distribution) with PMM Server. -
PMM-14321: Fixed a PMM Agent crash triggered when parsing slow query log entries containing queries that use
Valueas a column alias. -
PMM-14440: Fixed
excessive was collected before with the same name and label valueserrors inmysqld_exporterlogs that caused rapid log file growth. -
PMM-14568: Fixed
container is not a PMM servererror when upgrading PMM Server via the UI. This occurred when the image name was different frompmm-server. -
PMM-10308: Fixed missing metric queries in the MySQL Instance Summary dashboard that caused several panels to show
N/Ainstead of actual values. -
PMM-14534: Fixed duplicate and misleading panel names on the MySQL Instances Overview dashboard by renaming one of the panels from MySQL Temporary Objects to Top 5 MySQL Temporary Objects, so each panel now clearly reflects the metrics it displays.
-
PMM-14749: Fixed the Oplog GB/Hour panel on the MongoDB Sharded Cluster Summary dashboard, which showed No Data due to a missing query expression.
-
PMM-14747: Fixed Helm installation failure on OpenShift when using the
namespaceOverrideoption. The installation timed out with apmm-agent.yaml is not writable: permission deniederror due to incorrect file permissions. -
PMM-14709: Fixed low-contrast text that made the Upgrades are disabled alert banner unreadable under Configuration > Updates.
-
PMM-14670: Fixed a UInt32 bug that was preventing old Query Analytics data from being deleted. Data older than your retention period is now removed correctly in standard (non-HA) deployments. This issue persists in HA environments and will be addressed in a future release.
-
PMM-14664: Fixed a crash in PMM Server that could occur when the PostgreSQL QAN agent (
qan-postgresql-pgstatements-agent) was removed. Accessing server settings no longer triggers an error. -
PMM-14657: Fixed a crash that occurred when disabling update checks. PMM no longer shows errors or stops responding after turning off update checks via the Configuration > Settings page or API.
-
PMM-14624: Fixed an issue where your light/dark mode preference wasn’t loading correctly when logging in.
-
PMM-14615: Fixed an issue where PMM could not be installed on OpenShift in namespaces other than
default. The Helm chart now correctly overrides security context values instead of merging them with defaults. -
PMM-14573: Fixed MongoDB exporter connection leak that could crash MongoDB nodes in large deployments.
-
PMM-14640: Fixed a visual flicker on the Inventory > Services/Agents page that occurred during auto-refresh.
-
PMM-14431: Fixed a metric type mismatch in the MongoDB exporter that prevented PMM from collecting stats metrics.
-
PMM-14400: Fixed graph display on the Node Summary dashboard where the Total metric was obscuring other data due to incorrect opacity settings.
-
PMM-14364: Extended Patroni subnet configuration to support default EKS pod networking, fixing PMM Server connection failures on clusters created with
eksctl. -
PMM-14362: Fixed the Data Distribution panel on the MongoDB Sharded Cluster Summary dashboard showing inaccurate shard sizes.
-
PMM-14359: Fixed Memory Usage, Disk I/O, and Disk Usage panels on the MongoDB ReplSet Summary dashboard displaying incorrect values.
-
PMM-14442: Fixed
pmm-agentshowing incorrect Disconnected status after temporary network issues.
🔶 Known issues
Changing admin user password may fail due to a database lock
In rare cases, running the following command to change the admin user password:
docker exec pmm-server change-admin-password 'admin1'
[2026-01-14T09:37:03.591Z] logger=sqlstore t=2026-01-14T09:37:03.412196312Z level=info msg="Connecting to DB" dbtype=postgres
[2026-01-14T09:37:03.591Z] logger=migrator t=2026-01-14T09:37:03.419564945Z level=info msg="Locking database"
[2026-01-14T09:37:03.591Z] logger=migrator t=2026-01-14T09:37:03.420259904Z level=error msg="Failed to lock database" error="failed to obtain lock"
[2026-01-14T09:37:03.591Z] Error: ✗ failed to initialize runner: failed to initialize runner: failed to obtain lock
Resolution
To fix this issue:
-
Restart PostgreSQL inside the PMM Server container to release the lock:
supervisorctl restart postgresql -
Run the password change command again.
-
If the problem still persists, rerun the PMM server completely.