VictoriaMetrics Agents Overview
The VictoriaMetrics Agents Overview dashboard monitors the health and performance of VMAgent instances running on your monitored nodes. Use it to track scraping activity, remote write throughput, data ingestion, and resource usage across all agents in your environment.
This dashboard requires VMAgent v1.40.0 or higher.
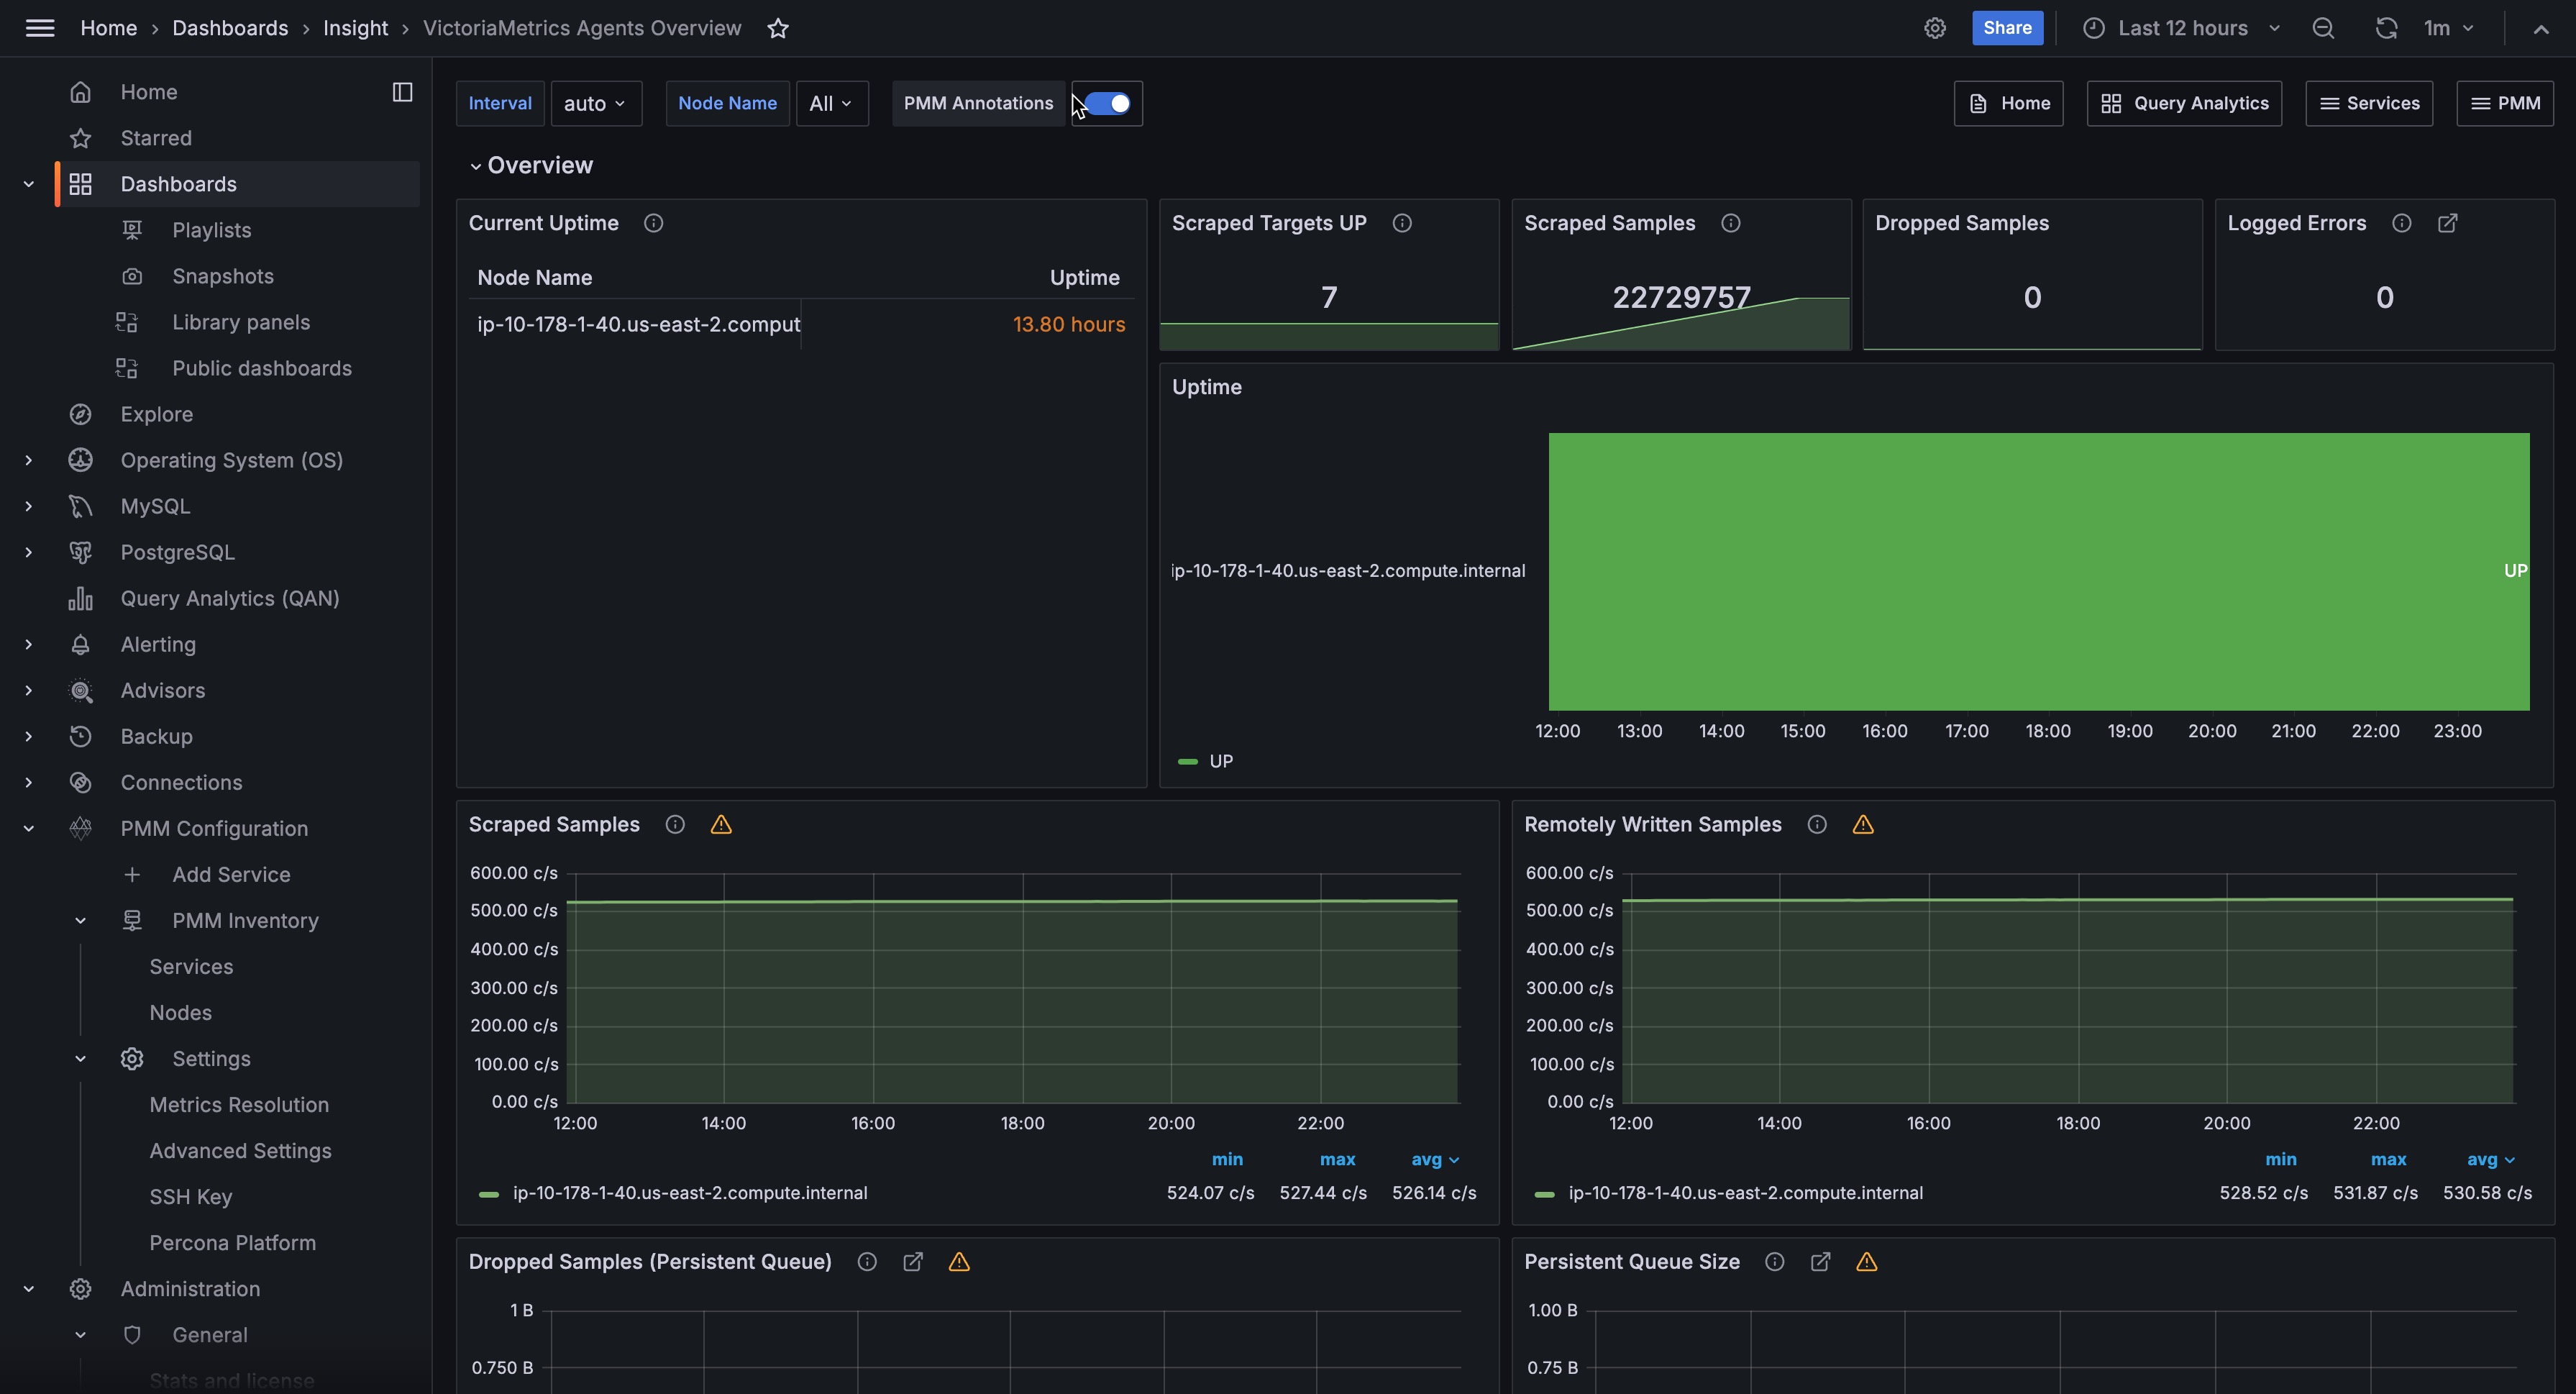
Overview
The Overview section gives you a snapshot of agent activity across all monitored nodes.
Current Uptime
Shows how long each VMAgent instance has been running, with one row per node, shortest uptime first. Click the Uptime column header to reverse the order. Red means under 1 hour, orange means 1 to 24 hours, and green means over 24 hours.
An agent restarts when a new service is added for monitoring, so a low value right after adding a service is expected. An unexpected low value at other times warrants investigation.
Scraped Targets UP
Shows the total number of scrape targets currently in an “up” state across pull and push modes.
Use this to confirm all configured targets are reachable. A drop here means agents are failing to reach one or more targets.
Scraped Samples
Shows the total number of samples collected over the selected time range, combining both scraped and pushed data.
Use this to confirm scraping is active and to spot sudden drops in data volume.
Dropped Samples
Shows the total number of samples discarded over the selected time range, across persistent queue drops and relabeling drops. Turns yellow at 1 drop and dark red at 1,000.
A non-zero value warrants investigation. Check Dropped Samples (Persistent Queue) and Dropped Samples (Relabeling) in the graphs below to identify the source.
Logged Errors
Shows the number of error-level log messages generated by VMAgent over the selected time range. Turns yellow at 1 error and dark red at 10.
A non-zero value may indicate connectivity issues or a misconfiguration. Expand the Logged Errors/Warnings Details section for a per-node breakdown.
Uptime
Shows the up/down state of each VMAgent instance per node as a timeline. Green means the agent is up, red means it is down.
The panel shows 8 nodes per page. When you select more nodes than that, page controls appear at the bottom of the panel. Nodes that are down are listed first, so problem nodes stay on the first page.
Use this to spot agents that are down or that have restarted recently.
Scraped Samples
Shows the per-node rate of samples collected via scraping, including both pull and push modes.
The rate shown here may differ from Remotely Written Samples because replication or additional time series added per scrape target can increase the outgoing rate.
Remotely Written Samples
Shows the per-node rate of samples sent to remote storage.
Compare this with Scraped Samples to identify replication-related differences between the incoming and outgoing sample rates.
Dropped Samples (Persistent Queue)
Shows the per-node amount of data, in bytes, dropped from the persistent queue during each interval. VMAgent drops samples when both in-memory and on-disk queues are full and it cannot reach remote storage.
A non-zero value means data is being lost. The maximum on-disk queue size is controlled by the -remoteWrite.maxDiskUsagePerURL flag.
Persistent Queue Size
Shows the per-node size in bytes of samples waiting to be flushed to remote storage.
A growing queue usually indicates connectivity problems. VMAgent buffers data to disk and retries once the connection is restored. Remote write URLs are hidden by default and can be revealed with the -remoteWrite.showURL flag.
Dropped Samples (Relabeling)
Shows the rate of samples dropped by relabeling rules, as one overall series and one series per remote write URL. This panel tracks only drops from -remoteWrite.relabelConfig.
Use this to verify that relabeling rules are not discarding more data than expected.
HTTP Requests
Shows the per-node rate of requests served by the VMAgent HTTP server.
Use this to understand overall request load on each agent. Expand the HTTP Requests/Errors Details section for a per-endpoint and per-node breakdown.
Scraping
The Scraping section shows how agents are collecting data from their configured targets.
Scrapes
Shows the per-node rate of scrape requests made by VMAgent.
Samples
Shows the per-node rate of samples collected by scraping.
Scrapes p0.95 Response Size
Shows the 95th percentile response size in bytes for scrape requests, per node.
Large values may increase memory usage or slow down scraping. Compare with Scrapes p0.5 Response Size to understand the spread.
Scrapes p0.5 Response Size
Shows the median response size in bytes for scrape requests, per node.
Timeout Scrapes
Shows the per-node rate of scrapes that timed out.
A rising value points to slow or unresponsive targets. Check network connectivity and target response times.
Failed Scrapes
Shows the per-node rate of scrapes that failed for any reason other than a timeout.
A non-zero value means some targets are unreachable or returning errors.
Dial Errors
Shows the per-node rate of connection errors when VMAgent attempts to reach a scrape target.
Use this to identify targets that are completely unreachable at the network level.
Gunzip Failed Scrapes
Shows the per-node rate of scrapes that failed during gzip decompression.
A non-zero value typically means the target is returning malformed compressed responses.
Ingestion
The Ingestion section covers data written directly to VMAgent via push-based protocols.
Write Requests
Shows the rate of write requests received by VMAgent ingest endpoints, broken down by protocol (UDP, TCP, HTTP).
Write Errors
Shows the rate of write errors across ingest endpoints, broken down by protocol.
A non-zero value means some incoming data is being rejected. Check logs for error details.
Parsed Rows
Shows the rate of rows successfully parsed from write requests and scrape responses, broken down by data format type.
Dropped Invalid Rows
Shows the rate of rows dropped because they could not be parsed, broken down by data format type.
A non-zero value means incoming data is malformed. Check VMAgent logs for the specific error messages.
Remote Write
The Remote Write section tracks how VMAgent is forwarding data to remote storage.
Remote Write Requests
Shows the rate of requests sent to each configured remote write endpoint, broken down by URL and HTTP status code.
Use this to identify endpoints returning errors. Remote write URLs are hidden by default and can be revealed with the -remoteWrite.showURL flag.
Remote Write Size
Shows the per-node rate of bytes written to remote storage.
Block Size Rows
Shows the distribution of remote write request block sizes in rows as a heatmap.
Block Size in Bytes
Shows the distribution of remote write request block sizes in bytes as a heatmap.
Requests Retry Rate
Shows the rate of retry attempts to each remote write endpoint. Retries are unlimited but use delays of up to 1 minute between attempts.
A sustained retry rate means the remote storage endpoint is unavailable or rejecting requests. Remote write URLs are hidden by default and can be revealed with the -remoteWrite.showURL flag.
Established Connections
Shows the current number of open connections to remote write endpoints, per node.
A drop to zero means VMAgent has lost connectivity to remote storage.
Resource usage
The Resource usage section shows the system resources consumed by each VMAgent instance.
CPU Usage
Shows CPU utilization per VMAgent instance.
Unexpectedly high usage may indicate a large number of targets, complex relabeling rules, or high cardinality data.
Memory Usage
Shows resident memory usage in bytes per VMAgent instance.
If usage seems abnormal, collect a memory profile for analysis.
Threads
Shows the number of OS threads used by each VMAgent instance.
Network Usage
Shows inbound and outbound byte rates for each VMAgent instance. Inbound traffic combines TCP listener reads and scrape connection reads. Outbound traffic reflects remote write bytes sent.
Differences between inbound and outbound rates are expected because scraping and remote write use different protocols.