Percona Monitoring and Management 3.2.0
| Release date | May 29th, 2025 |
|---|---|
| Installation | Installing Percona Monitoring and Management |
| Upgrade | Migrate PMM 2 to PMM 3 |
Percona Monitoring and Management (PMM) is an open source database monitoring, management, and observability solution for MySQL, PostgreSQL, and MongoDB. PMM empowers you to:
- monitor the health and performance of your database systems
- identify patterns and trends in database behavior
- diagnose and resolve issues faster with actionable insights
- manage databases across on-premises, cloud, and hybrid environments
Release summary
PMM 3.2.0 comes with better support for Amazon Linux 2023 and MySQL 8.4 replication, an upgrade to Grafana 11.6, secure ClickHouse connections, a new backup dashboard for MongoDB and faster filtering for QAN. This is in addition to many bug fixes and performance improvements!
Release highlights
Native PMM Client support for Amazon Linux 2023
PMM 3.2.0 introduces official RPM package support for installing the PMM Client on Amazon Linux 2023. If you’ve been deploying PMM Client on AL2023 and relying on tarball-based installation workarounds, you no longer need to — you can now install the Client through native RPM packages.
The RPM support streamlines setup with AL2023, and gets you monitoring databases faster.
Enhanced MySQL 8.4 support
PMM 3.2.0 now offers complete support for MySQL 8.4. While PMM 3.0.0 included partial compatibility with Query Analytics (QAN) and basic dashboards, it couldn’t track replication metrics. This was because MySQL 8.4 changed how it exposes replication metrics, shifting from traditional status variables to performance_schema tables.
With this release, we’ve upgraded the MySQL Exporter to version 0.17.2, to enable it to collect replication metrics from both legacy status variables and the new performance_schema tables. We’ve also reconfigured the MySQL Replication Summary dashboard to display these metrics properly regardless of their source.
This means that PMM can now provide complete replication monitoring across all supported MySQL versions (5.7, 8.0, and 8.4), including critical metrics like IO Thread status, SQL Thread status, and Replication Lag.
Grafana 11.6 update and upgrade path for external PostgreSQL users
PMM now ships with Grafana 11.6, which delivers enhanced visualization capabilities, a more efficient alerting workflow, and a wide range of improvements:
- Alert state history for reviewing historical changes in alert statuses over time. Full functionality requires Grafana Loki for log aggregation and specific Grafana configuration to enable centralized tracking and storage.
- Improved panel features and actions visualization for better dashboard interactivity
- Simplified alert creation with improved UI workflows
- Recording rules for creating pre-computed metrics to optimize dashboard performance
Dashboard improvements:
- Navigation bookmarks for quick access to frequently used dashboards
- State timeline supports pagination for better performance with large datasets
- Centralized alert history page for managing all alert rules
- Improved Grafana Scenes support for modern dashboard architecture
Upgrading to PMM 3.2.0 with an external PostgreSQL database
If you’re using an external PostgreSQL database, make sure to update your PMM Server configuration before upgrading to PMM 3.2.0. This is because Grafana 11.6 has a regression issue where the GF_DATABASE_URL environment variable is no longer sufficient for database configuration. See Migrate External PostgreSQL Configuration for PMM 3.2.0+ for step-by-step instructions.
Secure external ClickHouse connections
PMM now supports connecting to external ClickHouse servers using authenticated credentials.
You can now set the PMM_CLICKHOUSE_USER and PMM_CLICKHOUSE_PASSWORD environment variables when deploying PMM Server to enable access to password-protected ClickHouse instances, such as those managed by Altinity’s operator.
This means that previous authentication errors are resolved, you no longer need to embed credentials in connection strings, which makes your setup more secure.
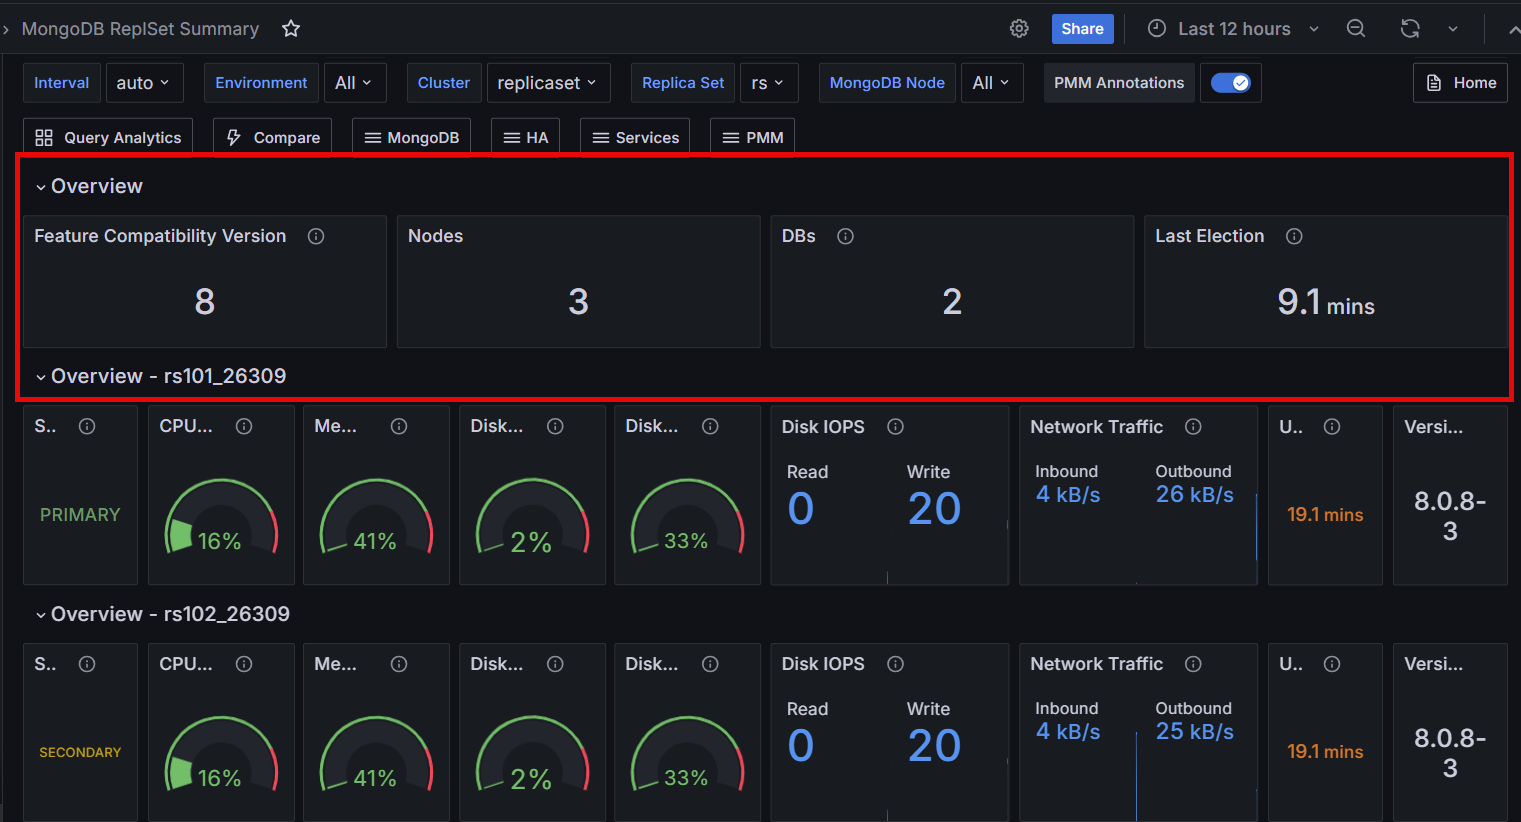
Feature Compatibility Version (FCV) panel in MongoDB dashboards
PMM now shows the current MongoDB Feature Compatibility Version (FCV) in the MongoDB Replica Set and MongoDB Sharded Cluster Summary dashboards.
This panel helps you quickly see if your cluster is running the expected FCV—especially after upgrades, when the FCV might not match the MongoDB version yet.
New PBM Details dashboard for MongoDB backups
PMM now includes a new MongoDB PBM Details dashboard that enables you to monitor MongoDB backups directly from PMM. This new dashboard is powered by the PBM collector and offers a unified, real-time view of all your backup activity across replica sets and sharded clusters.
It displays key information such as backup status, configuration, size, duration, PITR status, and details of the most recent successful backup—all in one place. If you’re already using Percona Backup for MongoDB (PBM) with PMM, this integration lets you track backup operations without switching between tools.
To get started, open the PBM Details dashboard and see how it works with your MongoDB environments.
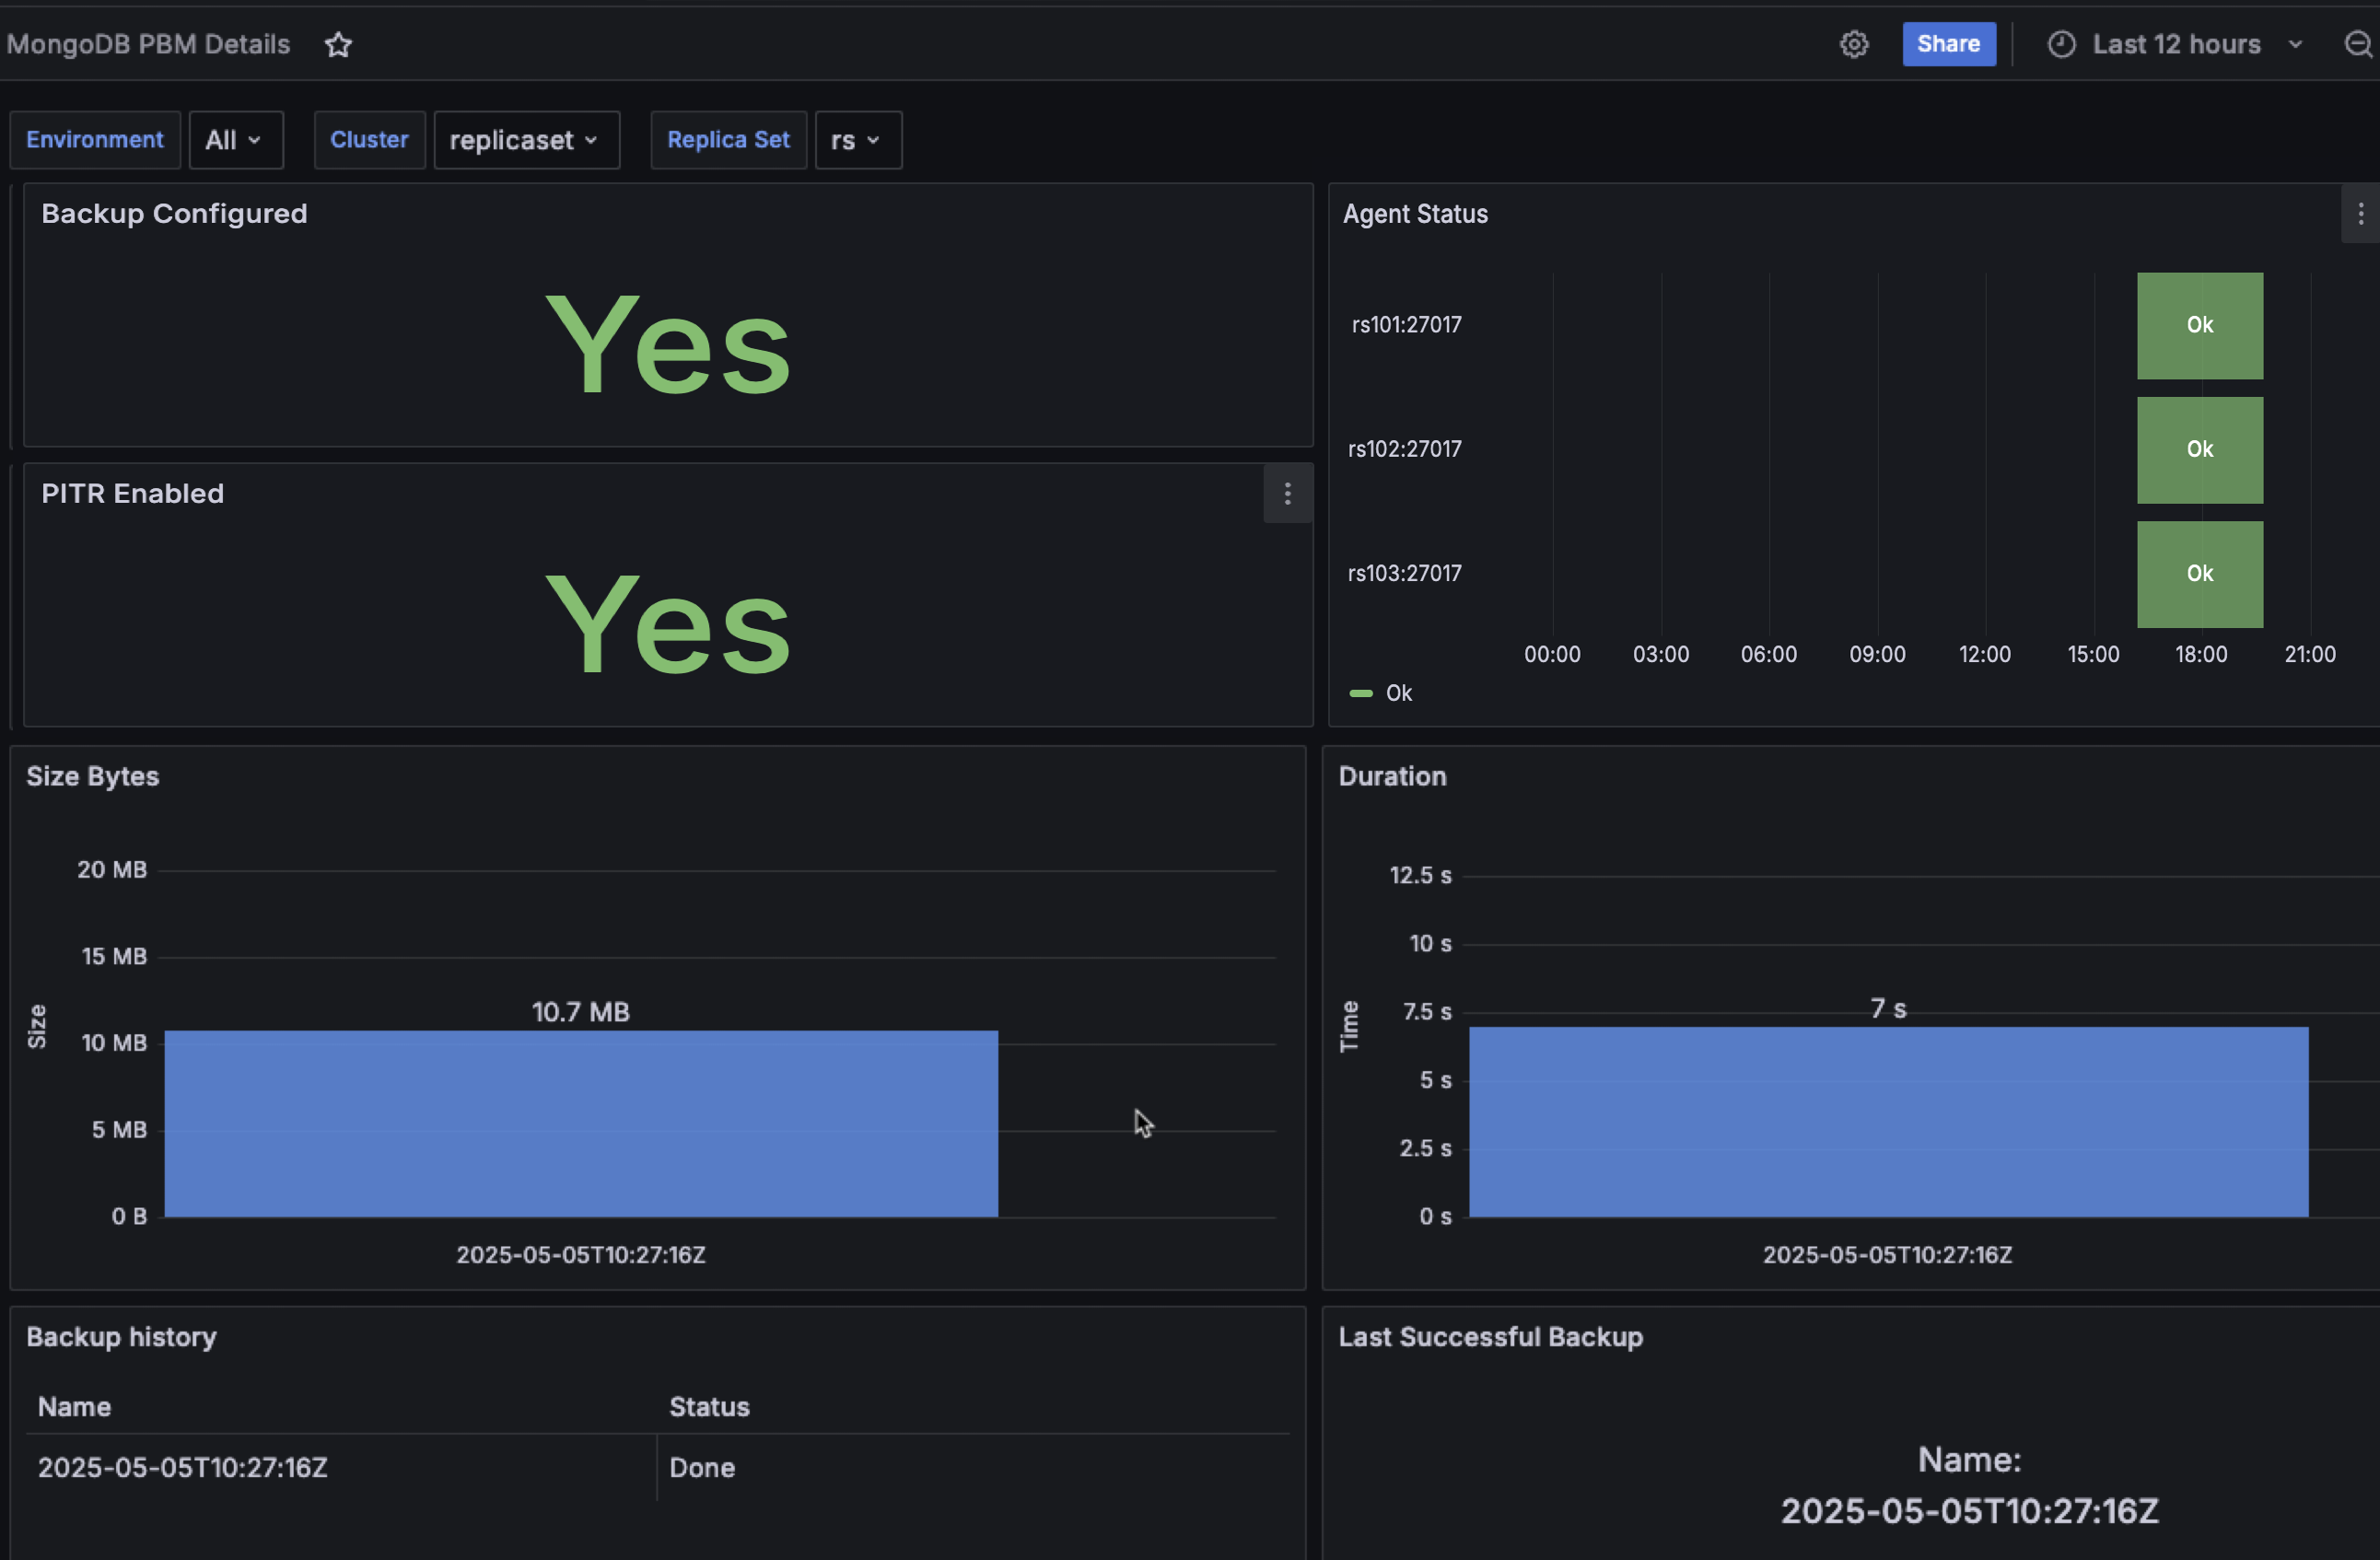
Future releases will improve the Backup history panel to better display certain error states and special conditions (like stuck or incompatible backups) that are currently only visible when using PBM's pbm status command directly.
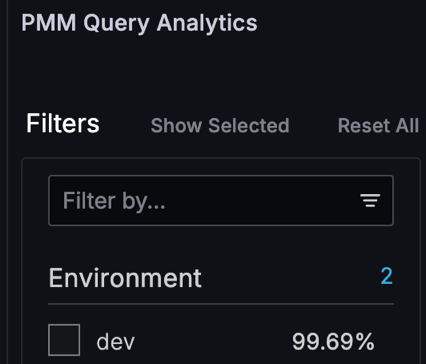
Improved Query Analytics filter performance
We’ve optimized QAN filter loading performance to reduce the number of processed rows by up to 95% in large environments. This means that the filters on the PMM Query Analytics page now load faster, which makes the interface more responsive.
Nomad integration for future extensibility
We’ve integrated HashiCorp Nomad into PMM to lay the groundwork for future feature development. This workload orchestrator will initially manage monitoring agents to improve service delivery for Percona customers.
If you are an advanced user, you can access the Nomad API (internal port 4646) through the standard PMM HTTPS port by appending /nomad to your PMM Server URL. The full API path is https://<pmm-server>/nomad/v1/. You must have Administrator rights to access this endpoint.
Nomad is disabled by default. Even though it increases the overall Docker image size, it has no performance impact when not enabled. For more information, see Nomad configuration.
Improvements
-
PMM-13453 - Improved how PMM checks for updates. Automatic checks now use cached information to reduce system load, while clicking Check for updates on the Updates page performs a thorough check for the latest versions.
This ensures you get the most accurate information when explicitly checking for updates, while improving overall system performance.
-
PMM-13644 - Added a default 30-day retention policy for ClickHouse system log tables (
trace_log,metric_log,query_log). This default policy keeps recent logs readily available for troubleshooting but prevents potential ClickHouse performance issues that excessive log data could cause.You can customize the retention by updating the Time-To-Live (TTL) expression (
event_date + INTERVAL X DAY DELETE) in the ClickHouse configuration. -
PMM-13869 - PMM now outputs Nginx access logs in LOGFMT format, ensuring consistency across all PMM components. This also improves compatibility with log analysis tools like Loki and VictoriaLogs, which means you can analyze logs directly without reformatting or manual parsing.
-
PMM-13171 - Added support for connecting to external ClickHouse databases with custom user credentials using the
PMM_CLICKHOUSE_USERandPMM_CLICKHOUSE_PASSWORDenvironment variables. -
PMM-13752 - Introduced a new PBM Details dashboard for MongoDB backups for backup operations monitoring directly within PMM.
-
PMM-13785 - You can now install PMM Client on Amazon Linux 2023 environments using official RPM packages, so you don’t need to use tarball-based workarounds.
-
PMM-13406 - Integrated HashiCorp Nomad into PMM to enable future extensibility.
-
PMM-13939 - Improved the performance of a frequently used query in QAN by optimizing the number of rows fetched from the database. This change reduces the time it takes to display QAN filters, resulting in a smoother user experience.
-
PMM-13824 - Updated MongoDB Replicaset summary dashboard and MongoDB Sharded cluster summary dashboard with a new panel to show the current Feature Compatibility Version. We’ve also added panels to show Nodes, Databases count and Last election time.
-
PMM-13832 - We’ve revised the PMM installation documentation to enhance technical accuracy, clarity, and usability. As we continue to refine the topics in this chapter, we welcome your feedback to help us make the documentation even better.
Components upgrade
-
PMM-13463 - PMM now ships with Grafana 11.6, bringing a suite of enhancements to visualization, alerting, and dashboard interactivity.
-
PMM-13210 - Upgraded VictoriaMetrics to version 1.114.0. This version includes key upstream improvements and fixes, ensuring more reliable metric collection, storage, and faster data access in PMM.
-
PMM-12153 - We’ve upgraded
mysqld_exporterto the latest stable version (v0.17.2), bringing you the newest features and critical fixes for enhanced MySQL metric collection and also ensuring compatibility with the latest upstream advancements.
Fixed issues
-
PMM-13139 - Fixed an issue in the ProxySQL Instance Summary dashboard where panels were not correctly filtered by the selected ProxySQL instance. Panels like Executed queries, Queries execution time, and Queries Latency now accurately display data specific to the chosen ProxySQL instance. We’ve also added a Hostgroup filter for a more granular analysis.
-
PMM-13766 - Fixed a security issue where TLS certificates and private keys were not being deleted from PMM Client’s temporary directories after removing the service. PMM now properly cleans up security-sensitive file when you remove services.
-
PMM-13958 - Fixed an issue where PMM Server would ignore the
PMM_POSTGRES_*environment variables and start the internal PostgreSQL instance even whenPMM_DISABLE_BUILTIN_POSTGRES=1was set. PMM now correctly detects external PostgreSQL settings, and no longer waits for the internal database to start when external settings are available. -
PMM-13780 - Fixed an issue in the SQL query that prevented group replication metrics from being collected. The MySQL Group Replication Summary dashboard now properly displays transaction and conflict metrics for MySQL 8.0 and 8.4 environments.
-
PMM-13635 - Fixed calculation issues in the MongoDB Collections Overview dashboard that previously resulted in empty or incorrect data displays. The dashboard now properly handles filter selections and displays accurate metrics.
These fixes also improve the Top 5 Databases by Size panel, which now accurately reflects database sizes when filtering by specific MongoDB nodes or replica sets.
-
PMM-13694 - Fixed an issue where PostgreSQL QPS calculations were incorrect in QAN when using non-default
pg_stat_statements.maxvalues greater than5000. -
PMM-13956 - The ProxySQL exporter would incorrectly transition to a
Donestatus instead ofRunningafter being added for monitoring. This prevented the exporter from collecting metrics from ProxySQL instances, which meant that PMM could not track ProxySQL performance accurately. This issue is now fixed. -
PMM-13909 - Fixed an issue where the Services list under PMM Inventory would automatically reset to page 1 while browsing other pages. You can now navigate through multiple pages of services without unexpected page resets.
-
PMM-13897 - Fixed an issue in QAN where selecting MongoDB Plan Summary filters containing bracketed expressions (such as
EXPRESS_IXSCAN { id: 1 }) would trigger internal server errors. PMM can now handle special characters in filter values, regardless of their syntax complexity. -
PMM-13807 -
pmm-agentwould crash when processing MySQL slow-log entries containing queries with a column named Value. This is now fixed and PMM can now properly monitor all SQL queries, regardless of column naming. -
PMM-13757 - Fixed an issue where MySQL query fingerprints sometimes incorrectly showed the execution time limit number (from
/*+ MAX_EXECUTION_TIME(<number>) */) instead of a?. These numbers are now always replaced with?for consistent query analysis. -
PMM-13966 - Checking the Explain plan in QAN for queries that themselves contained the
EXPLAINkeyword would result in an error: invalid GetActionRequest.ActionId: value length must be at least 1 runes. PMM now detects this scenario and clearly informs you that running EXPLAIN on such queries isn’t supported. -
PMM-13968 - Fixed a bug in QAN with MySQL Performance Schema where the same query run on different databases was only counted in one. Now, QAN correctly tracks these queries separately for each database.