Advanced Data Exploration
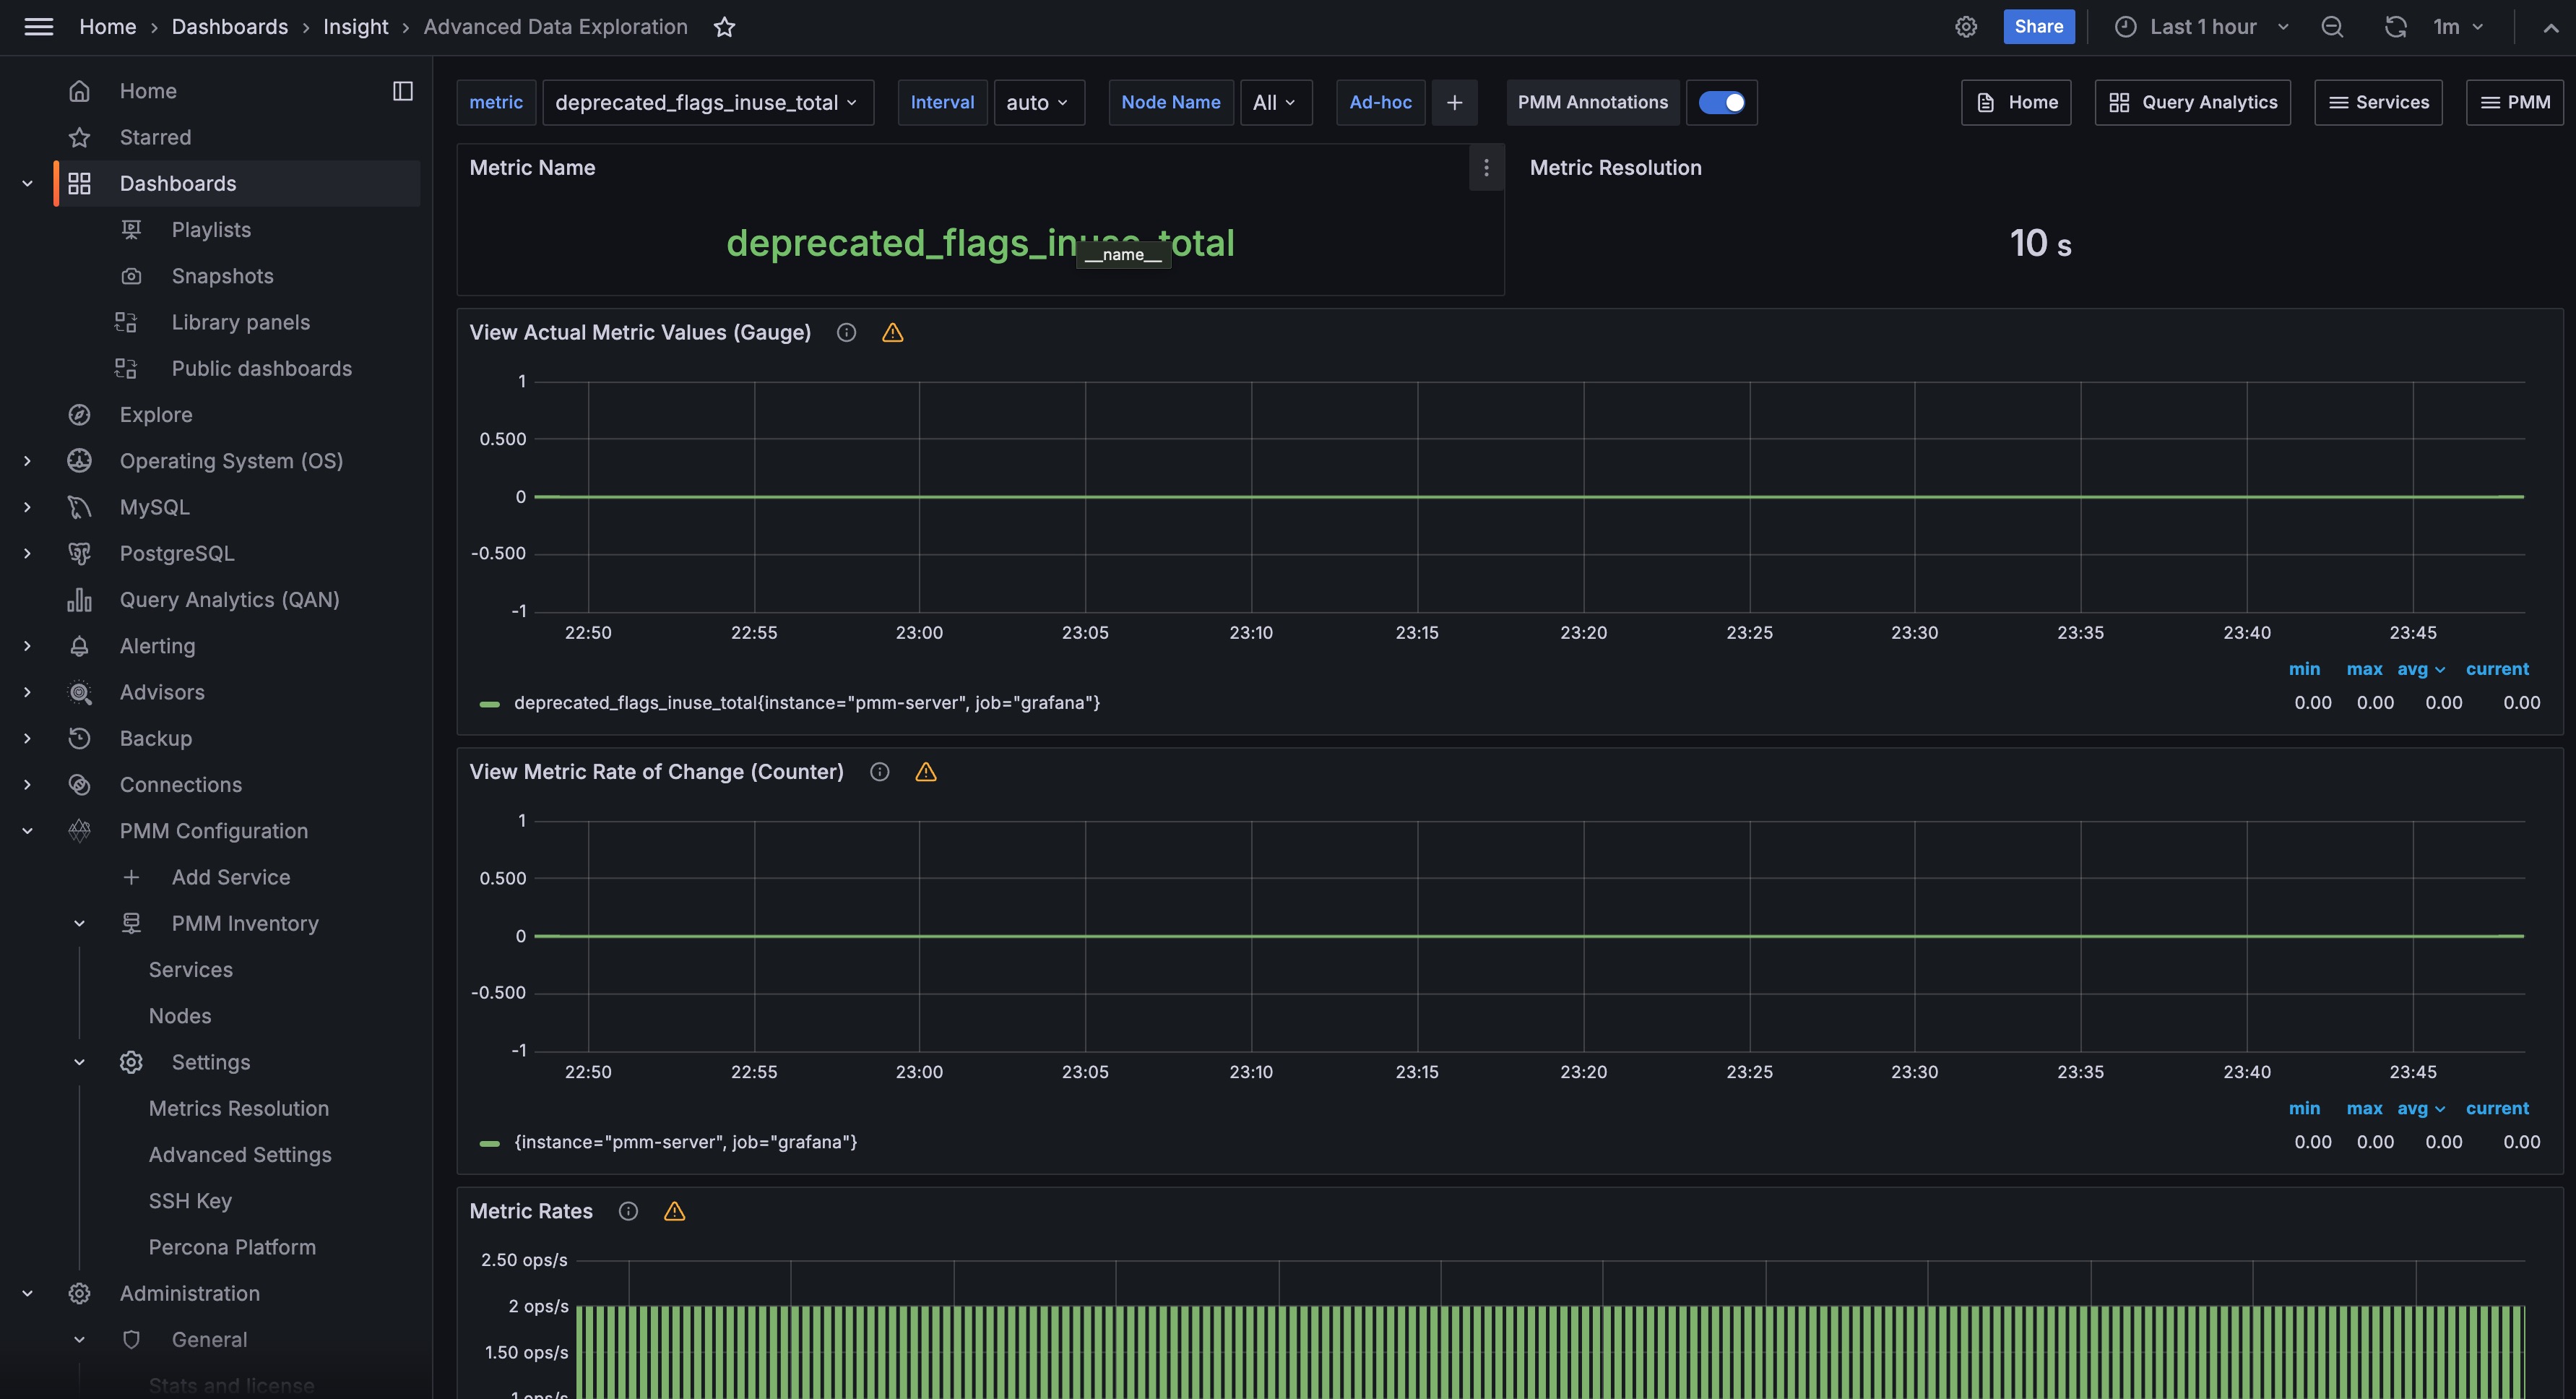
The Advanced Data Exploration dashboard provides detailed information about the progress of a single Prometheus metric across one or more hosts.
View actual metric values (Gauge)
A gauge is a metric that represents a single numerical value that can arbitrarily go up and down.
Gauges are typically used for measured values like temperatures or current memory usage, but also “counts” that can go up and down, like the number of running goroutines.
View Metric Rate of Change (Counter)
A counter is a cumulative metric that represents a single numerical value that only ever goes up. A counter is typically used to count requests served, tasks completed, errors occurred, etc. Counters should not be used to expose current counts of items whose number can also go down, e.g. the number of currently running goroutines. Use gauges for this use case.
Metric Rates
Shows the number of samples Per second stored for a given interval in the time series.
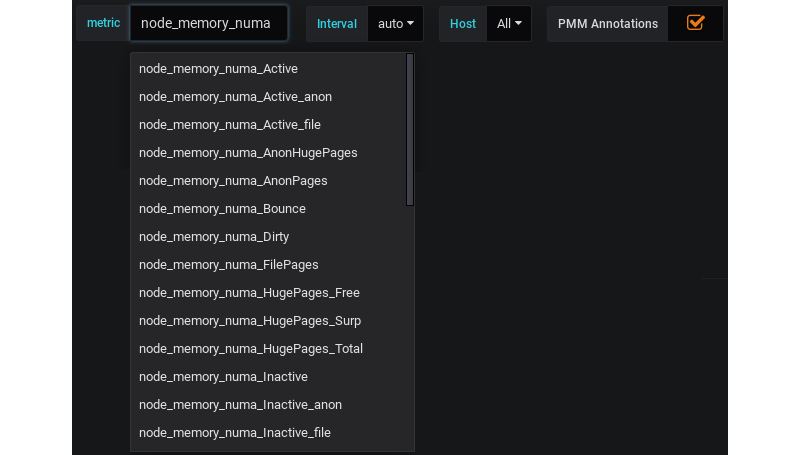
This dashboard supports metrics related to NUMA. The names of all these metrics start with node_memory_numa.
Metric Data Table
A table showing the raw metric values for the selected metric and node over time. Rows are sorted by Time descending so the most recent data appears first. Use this to pinpoint the exact moment a metric changed, or to confirm a value you saw in a graph panel.
- Time: When the data point was recorded. Use this to correlate a spike or drop with a specific event, such as a deployment, a batch job, or a restart.
- Value: The raw metric value at that timestamp. What this number means depends on the metric selected — check the metric name and unit in the dashboard variable selectors above.