Connect MySQL databases to PMM
Easily connect your MySQL databases—whether self-hosted or running on AWS EC2—to Percona Monitoring and Management (PMM) for in-depth performance insights.
Quick setup
Get your MySQL instance connected to PMM in just a few steps:
-
Create a dedicated MySQL user with the required permissions. If you are using an Administrative Connection, you will also need to grant the
SERVICE_CONNECTION_ADMINprivilege to thepmmuser:-- Create PMM user with required permissions CREATE USER 'pmm'@'localhost' IDENTIFIED BY 'StrongPassword123!' WITH MAX_USER_CONNECTIONS 10; GRANT SELECT, PROCESS, REPLICATION CLIENT, RELOAD ON *.* TO 'pmm'@'localhost'; -
Register your MySQL instance with PMM:
# Add MySQL service to PMM pmm-admin add mysql \ --username=pmm \ --password=StrongPassword123! \ --host=localhost \ --port=3306 \ --query-source=slowlog \ --environment=production \ MySQL-Primary -
Verify the connection is working:
pmm-admin status
That’s it! Your MySQL instance should now appear in PMM dashboards. For advanced configuration options, continue reading below.
Advanced configuration
PMM Client supports collecting metrics from various MySQL-based database systems:
For monitoring Amazon RDS MySQL instances, see Connect Amazon RDS instance.
Setup process at a glance
These are the high-level steps for configuring MySQL monitoring in PMM:
- Prerequisites: Ensure PMM Server is running and PMM Client is installed
- Create PMM user:
CREATE USER 'pmm'@'localhost' IDENTIFIED BY '<StrongPassword>' - Grant permissions:
GRANT SELECT, PROCESS, REPLICATION CLIENT, RELOAD ON *.* TO 'pmm'@'localhost' - Configure data source: Enable Slow Query Log or Performance Schema
- Add service: Use PMM UI or command line to add the MySQL instance
- Verify connection: Check PMM Inventory and dashboards for data
Prerequisites
Before connecting MySQL to PMM, review the prerequisites for your monitoring setup:
- PMM Server is installed and running.
- PMM Client is installed and the nodes are registered with PMM Server.
Root/sudoaccess is required if PMM Client was installed from packages (RPM/DEB) or if you need to access MySQL slow query logs. Non-root access may be sufficient if PMM Client was installed via tarball or if you’re only monitoring performance schema metrics
- PMM Server is installed and running
- PMM Server has direct network access to the MySQL instance
- You have a MySQL user with appropriate permissions on the remote MySQL instance.
When is root access required?
Root or sudo access on the client host is needed when:
- PMM Client was installed from RPM or DEB packages
- you want to monitor MySQL slow query logs (requires file system access)
- you need to configure system-level monitoring (CPU, memory, disk I/O)
For remote monitoring or when using only Performance Schema metrics, root access on the database server itself is not required.
Security setup
Create a database account for PMM
For security best practices, connect PMM Client to your database using a dedicated monitoring user with limited permissions.
Password security
- Use a strong, unique password for the PMM database user
- At least 12 characters long
- Mix of uppercase and lowercase letters
- Include numbers and special characters
- Avoid common words or patterns
- Never use default, test, or example passwords in production
This example creates a pmm user account that has just enough access to collect monitoring data without full administrative privileges:
CREATE USER 'pmm'@'localhost' IDENTIFIED BY '<your_strong_password>' WITH MAX_USER_CONNECTIONS 10;
GRANT SELECT, PROCESS, REPLICATION CLIENT, RELOAD ON *.* TO 'pmm'@'localhost';
CREATE USER 'pmm'@'localhost' IDENTIFIED BY '<your_strong_password>' WITH MAX_USER_CONNECTIONS 10;
GRANT SELECT, PROCESS, REPLICATION CLIENT, RELOAD, BACKUP_ADMIN ON *.* TO 'pmm'@'localhost';
Choose and configure a source
PMM can collect metrics from two primary sources: Slow query log and Performance Schema.
While you can use both at the same time we recommend using only one–there is some overlap in the data reported, and each incurs a small performance penalty.
The choice depends on the version and variant of your MySQL instance, and how much detail you want to see.
Data source comparison
Here are the benefits and drawbacks of Slow query log and Performance Schema metrics sources:
| Source | Best for | Advantages | Disadvantages |
|---|---|---|---|
| Slow Query Log | - Percona Server - When detailed query analysis is critical |
✔ More detailed query information ✔ Lower resource impact with query sampling |
⚠ Requires log file access ⚠ Log files need management ⚠ Higher disk I/O |
| Performance Schema | - MySQL 5.6+ - MariaDB 10.0+ - Production environments with resource constraints |
✔ Lower overhead ✔ Faster parsing ✔ No file management needed |
⚠ Less detailed query information ⚠ Higher memory usage |
Version-specific recommendations
| Database server | Versions | Recommended source |
|---|---|---|
| MySQL | 5.1-5.5 | Slow query log |
| MySQL | 5.6+ | Performance Schema |
| MariaDB | 10.0+ | Performance Schema |
| Percona Server for MySQL | 5.7, 8.0, 8.4 | Slow query log |
| Percona XtraDB Cluster | 5.6, 5.7, 8.0, 8.4 | Slow query log |
Configure data source
The slow query log records the details of queries that take more than a certain amount of time to complete.
With the database server configured to write this information to a file rather than a table, PMM Client parses the file and sends aggregated data to PMM Server via the Query Analytics part of pmm-agent.
Settings
| Variable | Value | Description |
|---|---|---|
slow_query_log |
ON | Enables the slow query log. |
log_output |
'FILE' |
Ensures the log is sent to a file. This is the default on MariaDB. |
long_query_time |
0 | The slow query threshold in seconds. In heavily-loaded applications, many quick queries can affect performance more than a few slow ones. Setting this value to 0 ensures all queries are captured. |
log_slow_admin_statements |
ON | Includes the logging of slow administrative statements. |
log_slow_slave_statements |
ON | Enables logging for queries that have taken more than long_query_time seconds to execute on the replica. |
Add these settings to your MySQL configuration file (my.cnf/my.ini):
# Enable slow query logging
slow_query_log = ON
log_output = FILE

# Log all queries (0 seconds threshold)
long_query_time = 0

# Include administrative and replica statements
log_slow_admin_statements = ON
log_slow_slave_statements = ON
Alternatively, set these variables at runtime:
SET GLOBAL slow_query_log = 1;
SET GLOBAL log_output = 'FILE';
SET GLOBAL long_query_time = 0;
SET GLOBAL log_slow_admin_statements = 1;
SET GLOBAL log_slow_slave_statements = 1;
For Percona Server for MySQL (5.7+, 8.x) and Percona XtraDB Cluster, add these additional settings:
| Variable | Value | Description |
|---|---|---|
log_slow_rate_limit |
100 | Defines the rate of queries captured by the slow query log. A good rule of thumb is 100 queries logged per second. For example, if your Percona Server instance processes 10,000 queries per second, you should set log_slow_rate_limit to 100 and capture every 100th query for the slow query log. |
log_slow_rate_type |
'query' |
Set so that it applies to queries, rather than sessions. |
slow_query_log_always_write_time |
1 | Specifies which queries should ignore sampling. With query sampling this ensures that queries with longer execution time will always be captured by the slow query log. |
log_slow_verbosity |
'full' |
Ensures that all information about each captured query is stored in the slow query log. |
slow_query_log_use_global_control |
'all' |
Configure the slow query log during runtime and apply these settings to existing connections. |
Configuration file example
# Sample 1% of queries (1 out of 100)
log_slow_rate_limit = 100
log_slow_rate_type = 'query'

# Always log queries slower than 1 second regardless of sampling
slow_query_log_always_write_time = 1

# Store comprehensive query information
log_slow_verbosity = 'full'

# Apply settings to existing connections
slow_query_log_use_global_control = 'all'
Session example
SET GLOBAL log_slow_rate_limit = 100;
SET GLOBAL log_slow_rate_type = 'query';
SET GLOBAL slow_query_log_always_write_time = 1;
SET GLOBAL log_slow_verbosity = 'full';
SET GLOBAL slow_query_log_use_global_control = 'all';
Slow query log rotation
The slow query log can grow quickly in size, potentially affecting your system performance. To manage this, PMM Client can automatically rotate the log files to prevent them from becoming too large, or you can choose to manage log rotation yourself:
To configure automatic rotation when adding a service, use the --size-slow-logs option with the pmm-admin command. This option sets the size threshold at which the slow query log file will be rotated.
The size is specified as a number followed by a suffix (e.g., 10M for 10 megabytes). For detailed syntax, see pmm-admin add mysql.
When the log reaches the specified size, PMM Client will:
- Remove the previous
.oldslow query log file. - Rename the current log file by appending the
.oldsuffix. - Execute the MySQL
FLUSH LOGScommand to finalize the rotation. - Only one
.oldfile is retained at a time, and older versions are automatically deleted.
If you prefer to handle log rotation manually, such as with logrotate, you can disable PMM Client’s automatic log rotation. To do this, set a negative value for the --size-slow-logs option when adding a service with the pmm-admin add command.
To configure a MySQL-based database server to use Performance Schema as a source of metrics:
Applicable versions
- Percona Server for MySQL: 5.6, 5.7, 8.0, 8.4
- Percona XtraDB Cluster: 5.6, 5.7, 8.0, 8.4
- MariaDB: 10.3+
PMM’s MySQL Performance Schema Details dashboard charts the various performance_schema metrics.
To use Performance Schema, set these variables:
| Variable | Value | Description |
|---|---|---|
performance_schema |
ON |
Enables Performance Schema metrics. This is the default in MySQL 5.6.6 and higher. |
performance-schema-instrument |
'statement/%=ON' |
Configures Performance Schema instruments. |
performance-schema-consumer-statements-digest |
ON |
Configures the statements-digest consumer. |
innodb_monitor_enable |
all | Enables InnoDB metrics counters. |
MySQL Performance Schema configuration examples
-
Configuration file:
performance_schema=ON performance-schema-instrument='statement/%=ON' performance-schema-consumer-statements-digest=ON innodb_monitor_enable=all -
Session:
(
performance_schemacannot be set in a session and must be set at server start-up.)UPDATE performance_schema.setup_consumers SET ENABLED = 'YES' WHERE NAME LIKE '%statements%'; SET GLOBAL innodb_monitor_enable = all;
MariaDB 10.5.7 or lower
There is no Explain or Example data shown by default in Query Analytics when monitoring MariaDB instances version 10.5.7 or lower. A workaround is to set this variable.
| Variable | Value | Description |
|---|---|---|
performance_schema.setup_instruments |
'statement/%' |
List of instrumented object classes. |
Session
UPDATE performance_schema.setup_instruments SET ENABLED = 'YES', TIMED = 'YES' WHERE NAME LIKE 'statement/%';
UPDATE performance_schema.setup_consumers SET ENABLED = 'YES' WHERE NAME LIKE '%statements%';
Transactions
MariaDB doesn’t implement queries history for transactions. All queries executed within a transaction won’t have query examples since PMM relies on the performance_schema.events_statements_history to grab the query example but that table won’t have any query executed as part of a transaction.
This behavior is because MariaDB doesn’t implement these consumers:
events_transactions_current
events_transactions_history
events_transactions_history_long
Query response time
Query time distribution is a chart in the Details tab of Query Analytics showing the proportion of query time spent on various activities. It is enabled with the query_response_time_stats variable and associated plugins.
Supported versions
- Percona Server for MySQL: 5.7 (available through Post-EOL support program)
- NOT available in Percona Server for MySQL 8.x (removed features)
- MariaDB: 10.0.4
Limited version support
This feature is not available in current Percona Server 8.x. Use this information only if you are using Percona Server 5.7 through our Post-EOL support program, where it remains actively supported.
Required variable
To enable query time distribution charts, set the [query_response_time_stats][ps_query_response_time_stats] = ON and install the plugin.
Plugin installation
Before installing the plugins, ensure you have the necessary plugin files and run these commands in your MySQL session:
- Check that
/usr/lib/mysql/plugin/query_response_time.soexists. -
Install the plugins and activate:
For MariaDB 10.3, run:
INSTALL PLUGIN QUERY_RESPONSE_TIME_AUDIT SONAME 'query_response_time.so';
INSTALL PLUGIN QUERY_RESPONSE_TIME SONAME 'query_response_time.so';
SET GLOBAL query_response_time_stats = ON;
For Percona Server for MySQL 5.7, run:
INSTALL PLUGIN QUERY_RESPONSE_TIME_AUDIT SONAME 'query_response_time.so';
INSTALL PLUGIN QUERY_RESPONSE_TIME SONAME 'query_response_time.so';
INSTALL PLUGIN QUERY_RESPONSE_TIME_READ SONAME 'query_response_time.so';
INSTALL PLUGIN QUERY_RESPONSE_TIME_WRITE SONAME 'query_response_time.so';
SET GLOBAL query_response_time_stats = ON;
Tablestats
Some table metrics are automatically disabled when the number of tables exceeds a default limit of 1000 tables. This prevents PMM Client from affecting the performance of your database server.
You can change the limit when configuring MySQL performance improvements with the following options:
pmm-admin option |
Description |
|---|---|
--disable-tablestats |
Disables tablestats collection when the default limit is reached. |
--disable-tablestats-limit=N |
Sets the number of tables (N) for which tablestats collection is disabled. 0 means no limit. A negative number means tablestats is completely disabled (for any number of tables). |
User statistics
Applicable versions
User activity, individual table and index access details are shown on the MySQL User Details dashboard when the userstat variable is set:
- Percona Server for MySQL: 5.6, 5.7, 8.0, 8.4
- Percona XtraDB Cluster: 5.6, 5.7, 8.0, 8.4
- MariaDB: 5.2.0+
MySQL user statistics configuration examples
-
Configuration file:
userstat=ON. -
Session:
SET GLOBAL userstat = ON;
Disable query example collection
PMM can collect query examples to help analyze query performance with real-world data. However, you can disable this collection when handling sensitive information.
When query examples are disabled, Query Analytics continues to function normally with query fingerprints and performance metrics. However, the Examples tab will not display query examples, and the Explain functionality will use placeholders instead of actual data values. To disable query examples for data privacy:
When adding a MySQL service through the PMM UI, expand Advanced Settings and check Disable query examples. This prevents PMM from storing actual query values while maintaining all other Query Analytics functionality.
Use the --disable-queryexamples flag when adding a MySQL service:
    pmm-admin add mysql \
    --username=pmm \
    --password=StrongPassword \
    --host=localhost \
    --port=3306 \
    --query-source=slowlog \
    --disable-queryexamples \
    MySQL-Private
Add service to PMM
After creating your PMM database user, you can add your MySQL service to PMM using the command line or the UI.
The command line (pmm-admin) deploys an exporter directly on the database host and automatically collects node-level metrics (CPU, memory, disk I/O) alongside MySQL metrics. Use the UI only if you cannot install PMM Client on the database host.
Add a local MySQL instance with default settings:
pmm-admin add mysql \
  --username=pmm \
  --password=StrongPassword \
  --host=localhost \
  --port=3306 \
  --query-source=slowlog \
  MySQL-Primary
Add a remote MySQL instance:
pmm-admin add mysql \
  --username=pmm \
  --password=StrongPassword \
  --host=remote-mysql.example.com \
  --port=3306 \
  --query-source=perfschema \
  --environment=production \
  Remote-MySQL
Add an instance with environment and custom labels:
pmm-admin add mysql \
  --username=pmm \
  --password=StrongPassword \
  --host=localhost \
  --port=3306 \
  --query-source=slowlog \
  --environment=production \
  --custom-labels="role=primary,datacenter=east" \
  MySQL-Primary
Add an instance with TLS security:
pmm-admin add mysql \
  --username=pmm \
  --password=StrongPassword \
  --host=mysql-server.example.com \
  --port=3306 \
  --tls \
  --tls-ca=/path/to/ca.pem \
  --query-source=slowlog \
  MySQL-TLS
If your MySQL instance uses PAM authentication plugins (such as auth_pam_compat) or other external authentication methods that require cleartext password transmission, use the --extra-dsn parameter:
pmm-admin add mysql \
--username=mysql_user \
--password=mysql_password \
--host=localhost \
--port=3306 \
--extra-dsn="allowCleartextPasswords=1" \
--query-source=slowlog \
MySQL-PAM
If you need PAM authentication with TLS:
pmm-admin add mysql \
  --username=mysql_user \
  --password=mysql_password \
  --host=mysql-server.example.com \
  --port=3306 \
  --extra-dsn="allowCleartextPasswords=1" \
  --tls \
  --tls-ca=/path/to/ca.pem \
  --query-source=slowlog \
  MySQL-PAM-Secure
Security warning
The allowCleartextPasswords=1 parameter transmits passwords without encryption.
Only use when connections are secured with TLS/SSL or over trusted networks.
To add the service from the user interface:
-
Go to Inventory > Add Service.
-
Select MySQL service type.
-
Enter or select values for the fields:
- Service Name: A descriptive name for your MySQL instance
- Host/Socket: Use
localhostfor local monitoring or hostname/IP for remote monitoring - Port: MySQL port (default: 3306)
- Username: The PMM user created earlier
- Password: Your PMM user password
- Query Source: Choose between Slow Log or Performance Schema
- PMM Agent: Select which PMM agent should monitor this instance
- Disable query examples: Check this option to prevent collection of actual query values in QAN. When enabled, PMM will continue to collect query metrics and statistics but will not store the actual query examples with real data values.
- Connection timeout: How long PMM should wait when connecting to this service. Increase this for remote or high-latency databases. If the connection times out, PMM retries the next time it collects metrics. Leave empty to use the default of 2s.
-
Click Add Service.
-
If using TLS, check Use TLS for database connections and fill in your TLS certificates and key information.
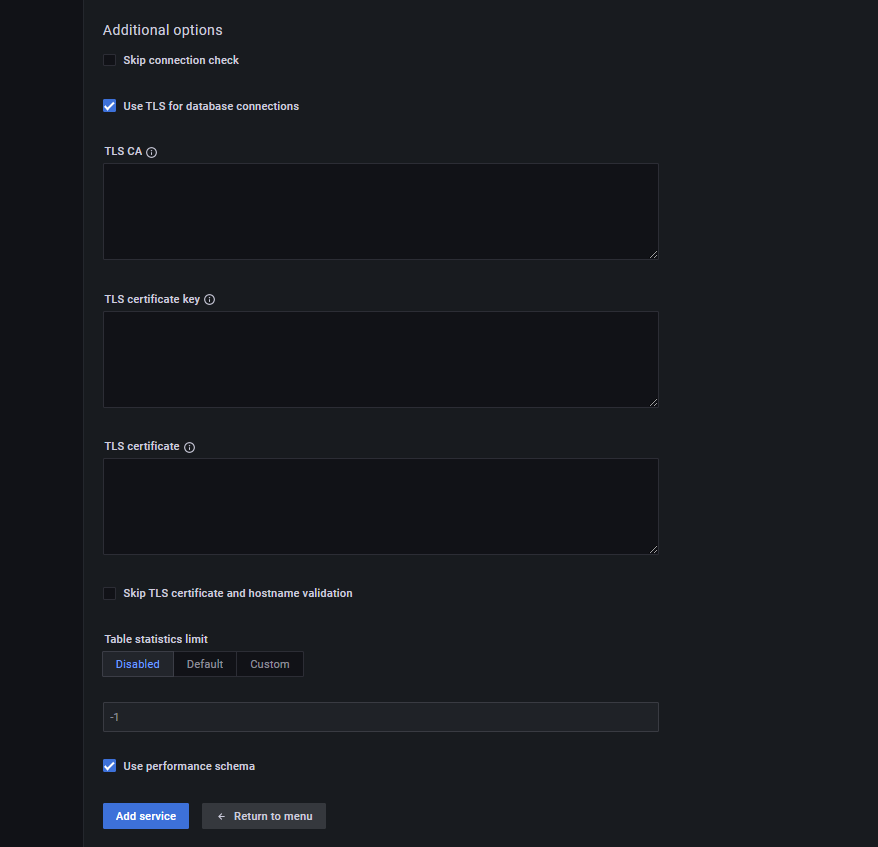
TLS/SSL certificate configuration
PMM supports flexible TLS certificate configurations for MySQL connections, enabling you to use partial certificates when client authentication is not required.
For many cloud providers (Azure MySQL, Google Cloud SQL) and self-signed certificates, you only need the CA certificate to establish encrypted connections:
pmm-admin add mysql \
--username=pmm \
--password=StrongPassword \
--host=mysql-server.example.com \
--port=3306 \
--tls \
--tls-ca=/path/to/ca.pem \
--query-source=perfschema \
MySQL-Secure
When your MySQL server requires client certificate authentication, provide all three certificate files:
pmm-admin add mysql \
--username=pmm \
--password=StrongPassword \
--host=mysql-server.example.com \
--port=3306 \
--tls \
--tls-ca=/path/to/ca.pem \
--tls-cert=/path/to/client-cert.pem \
--tls-key=/path/to/client-key.pem \
--query-source=perfschema \
MySQL-TLS-Full
Certificate requirements:
--tls-ca: CA certificate (required for TLS connections)--tls-cert: Client certificate (optional, only needed for client authentication)--tls-key: Client private key (optional, only needed for client authentication)
Keep in mind that providing only client certificate and key without the CA is not supported.
After adding the service
Upon successful addition, PMM Client will display a confirmation message:
MySQL Service added
Service ID  : /service_id/abcd1234-5678-efgh-ijkl-mnopqrstuvwx
Service name: MySQL-Primary
Verify your MySQL service
After adding your MySQL service to PMM, it’s important to verify that it’s properly connected and collecting data.
Check service status
Use these commands to manage and monitor your MySQL services:
-
List all MySQL services and their status:
pmm-admin inventory list services --service-type=mysql -
Find more detailed information about a specific service:
pmm-admin describe service --service-name="MySQL-Service-Name" -
Check the overall PMM Client status:
pmm-admin status
To verify your service in the web interface:
- Navigate to Inventory > Services.
- In the Services tab, find your newly added MySQL service.
- Verify the Service Name and Address match your configuration.
- Check the Status column shows as Active.
- In the Options column, expand the Details section to confirm:
- the correct agents are running
- your selected query source (Slow Log or Performance Schema) is active
Verify data collection
Once the service is confirmed as active, verify that metrics are being properly collected:
To verify basic MySQL metrics are being collected:
- Open the MySQL Instance Summary dashboard
- Select your MySQL service from the Service Name dropdown
- Confirm that metrics are appearing on the dashboard
- Check that the graphs show recent data (within the last few minutes)
For Percona Server for MySQL or MariaDB:
If you installed the Query Response Time plugin, verify it:
- Open the MySQL Query Response Time Details dashboard.
- Select your service from the dropdown.
- Alternatively, go to Query Analytics, select a query, and check for the Query time distribution bar.
For Percona XtraDB Cluster: To verify XtraDB Cluster monitoring:
- Open the [PXC/Galera Cluster Summary dashboard][DASH_PXCGALERACLUSTER].
- Select your cluster service from the dropdown.
- Verify that cluster-specific metrics are being displayed.
Running custom queries
To collect metrics beyond what PMM provides by default, you can define custom SQL queries for the MySQL exporter. See Running custom queries in MySQL.
Related topics
- Percona Server for MySQL – slow query log extended
- Percona Server for MySQL – user statistics
- MariaDB – Slow query log overview
- MariaDB – Slow query log extended statistics
- MariaDB – User statistics
- PERFORMANCE_SCHEMA vs Slow Query Log: performance impact
- Understanding MySQL’s INNODB_METRICS table
- Rotating MySQL slow logs safely
- Impact of logging on MySQL’s performance
- Running custom MySQL queries in PMM