Monitoring
Percona Everest provides monitoring capabilities with PMM to maintain a reliable and secure database infrastructure.
Important
Currently only PMM v2.x is supported. Support for PMM v3.x is planned for future releases.
Here are some key benefits you’ll get with monitoring of Percona Everest:
- Database availability and uptime tracking
- Insights into your database performance
- Proactive issue detection and addressing opportunities
- Continuous monitoring
The concept of namespaces in monitoring
When you assign namespaces to a monitoring instance, it only determines which databases are authorized to utilize it; you cannot monitor specific namespaces.
Each database can only be monitored by one instance, which means that the metrics for the database are only available to that instance.
When adding a new monitoring instance, the monitoring stack (kube-state-metrics and victoria-metrics) will automatically start pushing Kubernetes metrics to that instance.
Prerequisites
To use monitoring in Percona Everest, you should have a PMM instance up and running.
For information on installing PMM, see the documentation.
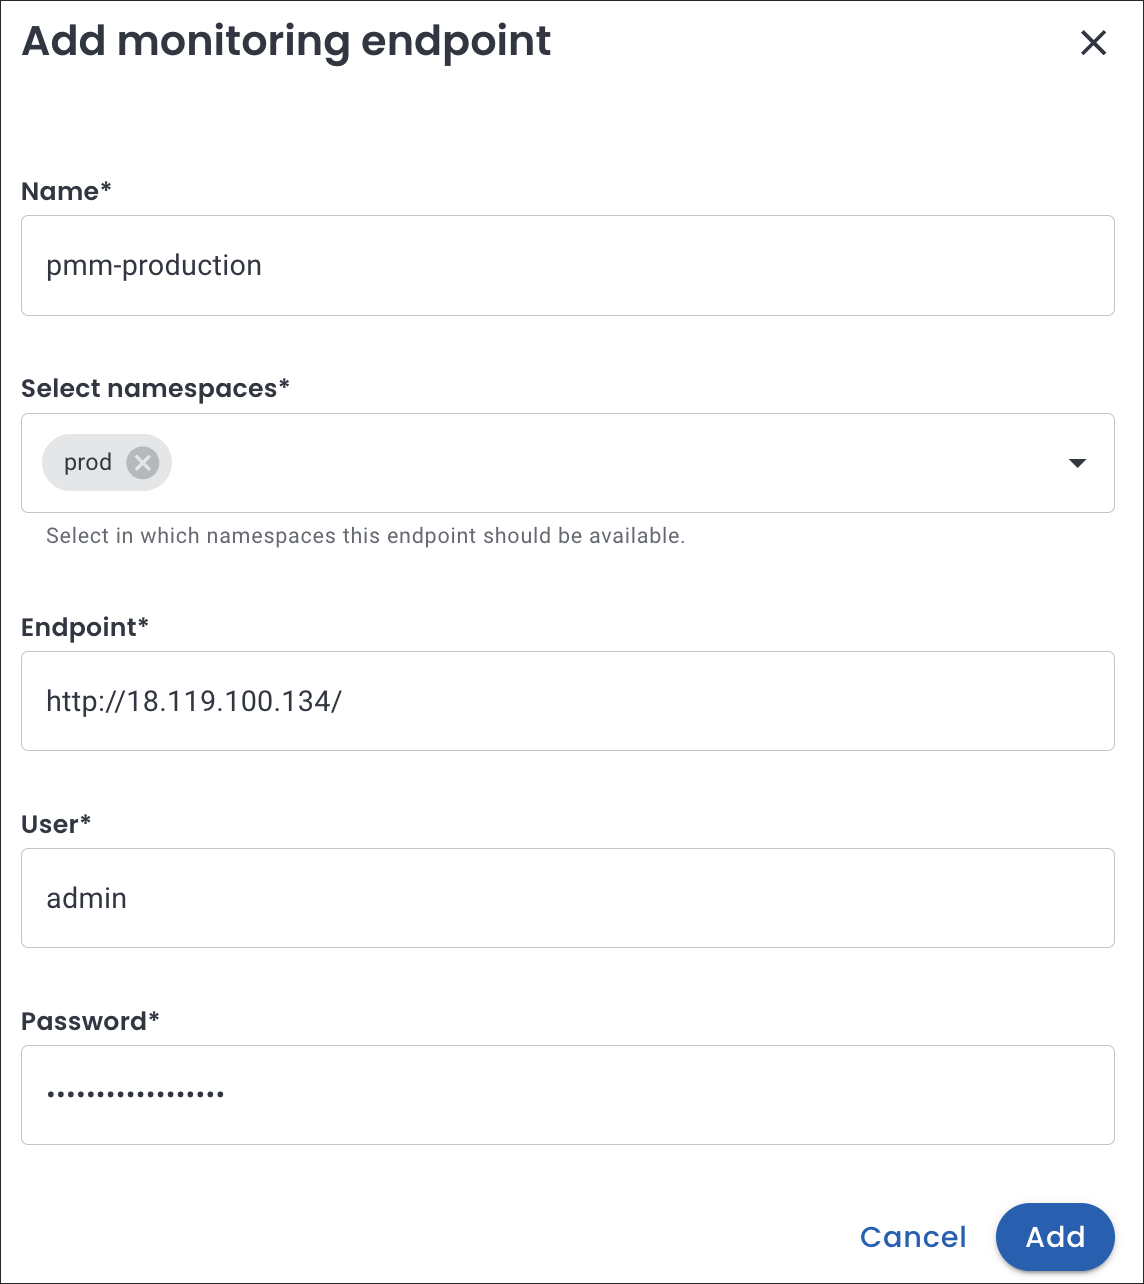
Add monitoring endpoint
To add monitoring in Percona Everest from the UI:
-
From the Percona Everest Homepage, navigate to Settings > Monitoring endpoints. The Add monitoring endpoint dialogue box opens.
-
On the Add monitoring endpoint screen, enter a name for the monitoring instance.
-
Select the namespaces where the monitoring endpoint should be available.
-
In the Endpoint field, enter the PMM URL. Enter the credentials received upon installing PMM in the User and Password field.
Warning
When setting up a new monitoring instance, if your PMM instance uses a self-signed certificate, skip the Verify TLS verification checkbox.
-
Click Add.
Enable monitoring
Enable monitoring for a new cluster
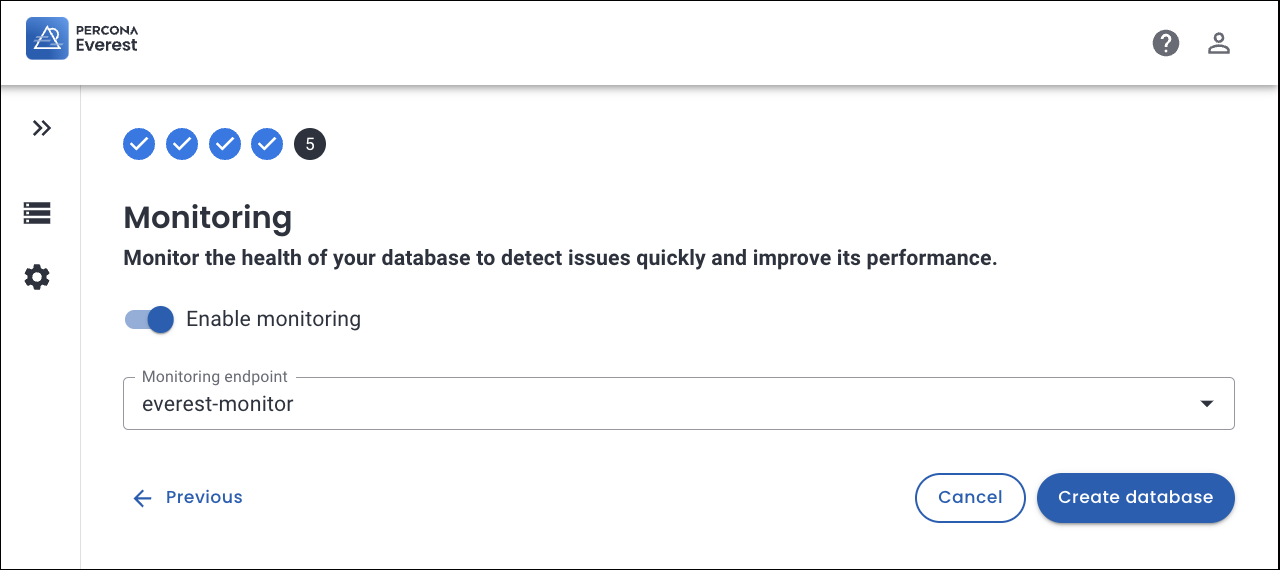
You can enable monitoring for your cluster while creating the database.
To enable monitoring for your database cluster, follow these steps:
-
From the Percona Everest Home page, click Create Database. The Create Database wizard opens.
-
Navigate till you reach the Monitoring page.
-
Turn on the Enable monitoring toggle.
-
Select the Monitoring endpoint from the drop down.
-
Click Create Database. This will allow you to monitor your database cluster.
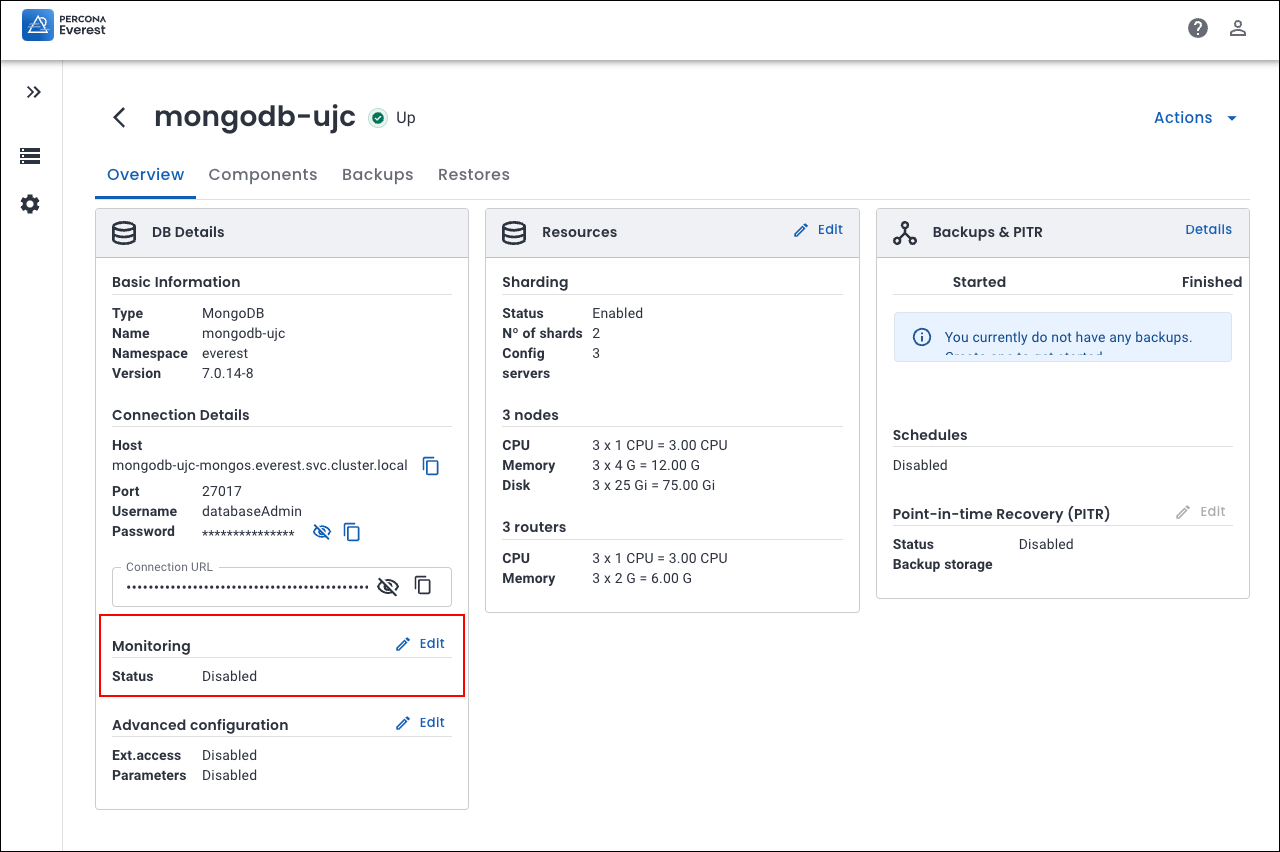
Enable monitoring for an existing cluster
You can enable monitoring for your cluster even after the database has been created.
To enable monitoring for your database cluster, follow these steps:
-
Navigate to the Percona Everest homepage and choose the database cluster you want to monitor.
-
Navigate to the Overview page and look for the Monitoring panel. Click on Edit.
-
Turn on the Enable monitoring toggle.
-
Select the Monitoring endpoint from the drop-down.
-
Click Save. This will allow you to monitor your database cluster.
Connect to PMM and monitor your databases
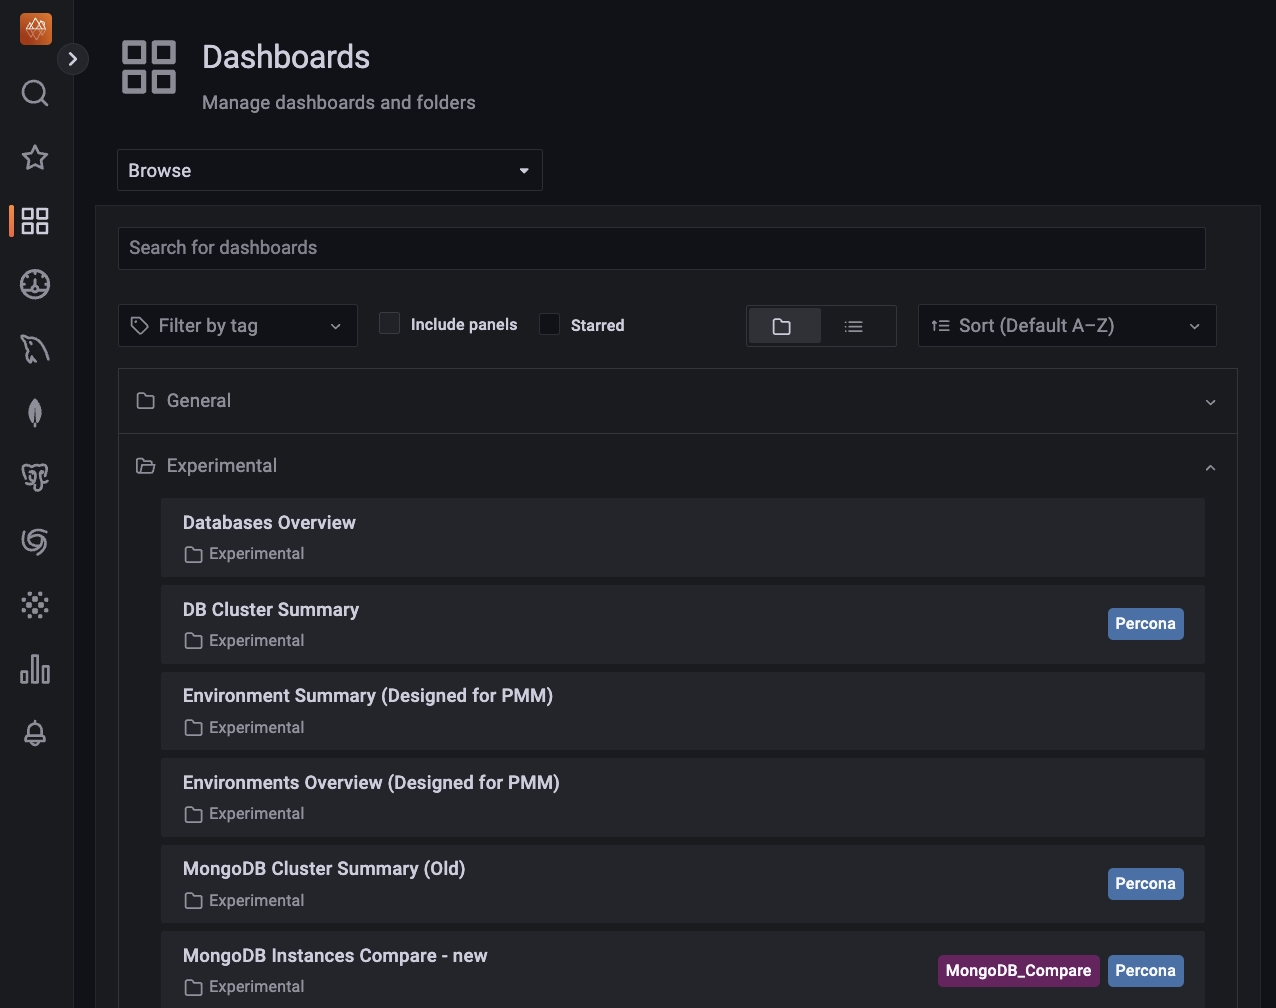
Here’s how to monitor your databases using PMM:
-
Log in to PMM.
-
From the PMM home page, go to Dashboards > Experimental. Here, you’ll discover a comprehensive view of the various databases that you can view.
-
Go to Experimental > Databases Overview to access the Database Overview dashboard. The following image shows that two PostgreSQL databases are monitored.
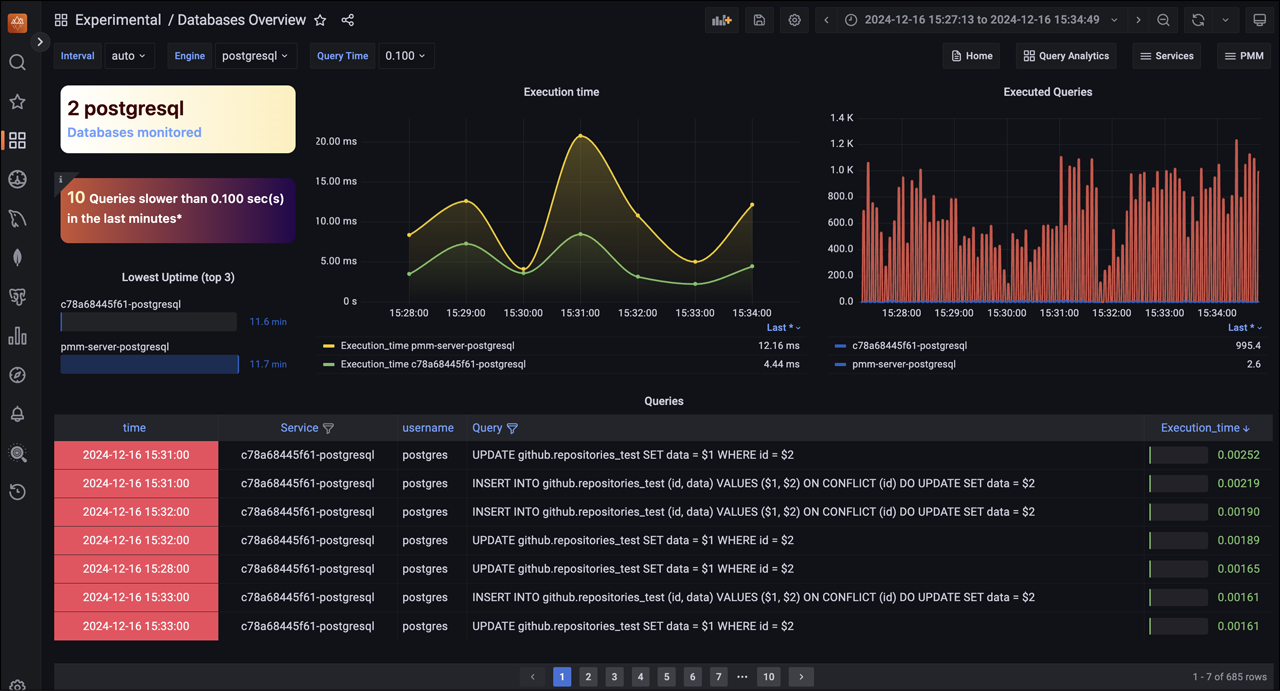
-
On the Databases Overview dashboard, you can monitor a specific database. To do this, select the desired database Engine from the drop-down menu.
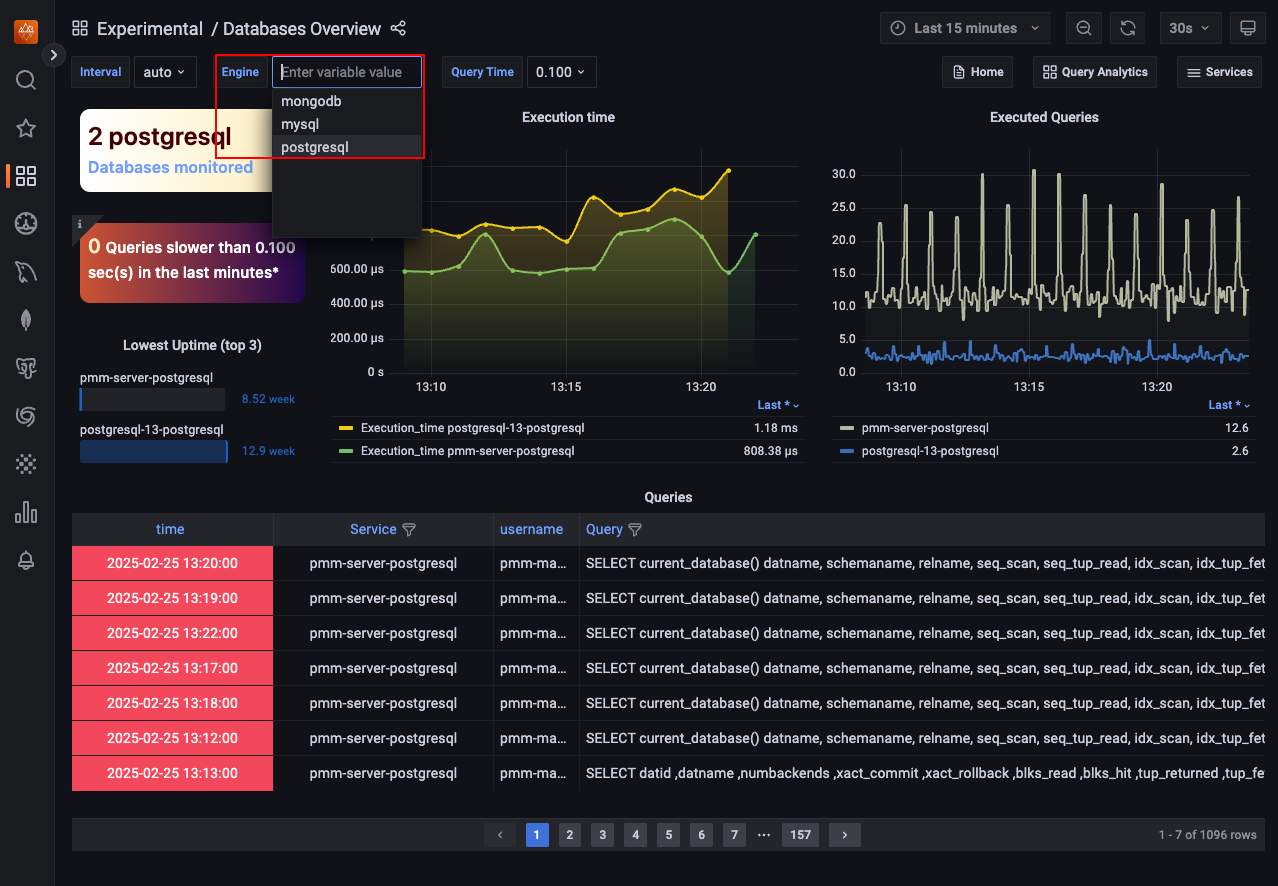
On this dashboard, you will find a graphical representation that highlights the following:
- A comprehensive list of databases under monitoring
-
A clear identification of slow-performing queries
-
The execution time for each query
-
A record of all executed queries, providing an overview of the activity.
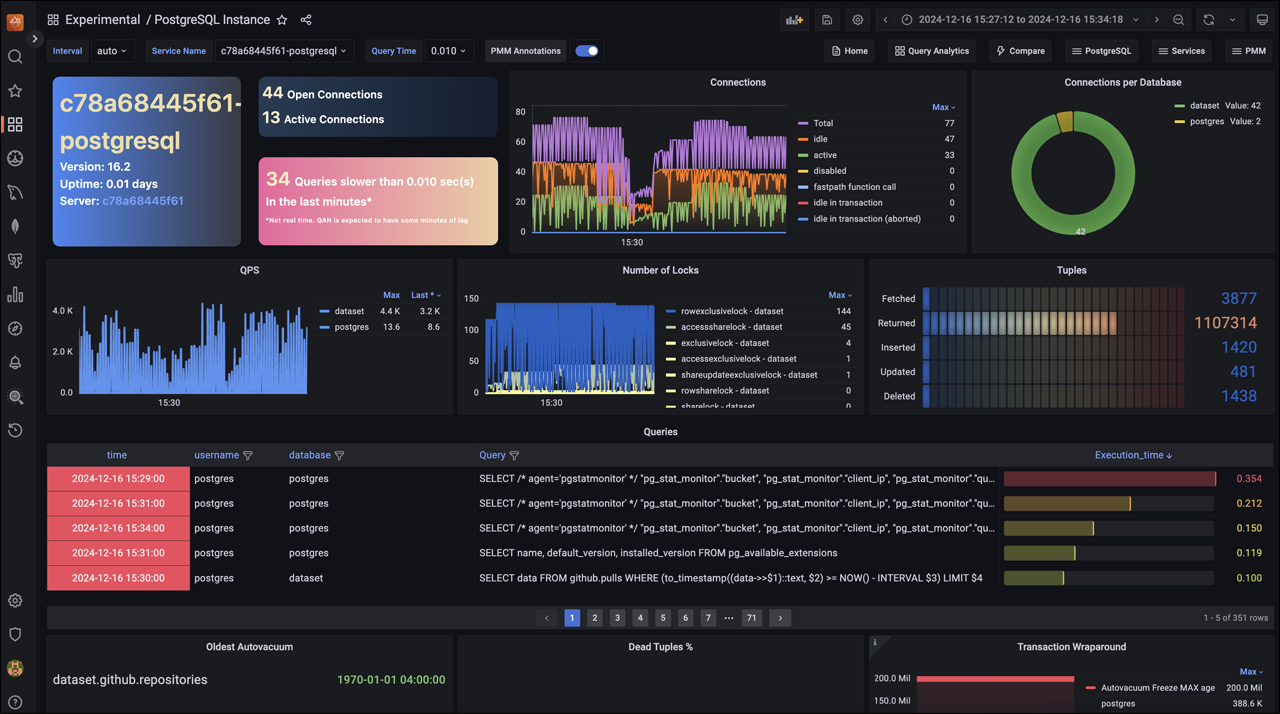
-
For instance, to get a comprehensive view of your PostgreSQL databases being monitored, go to Dashboards > Experimental > PostgreSQL Instance.
-
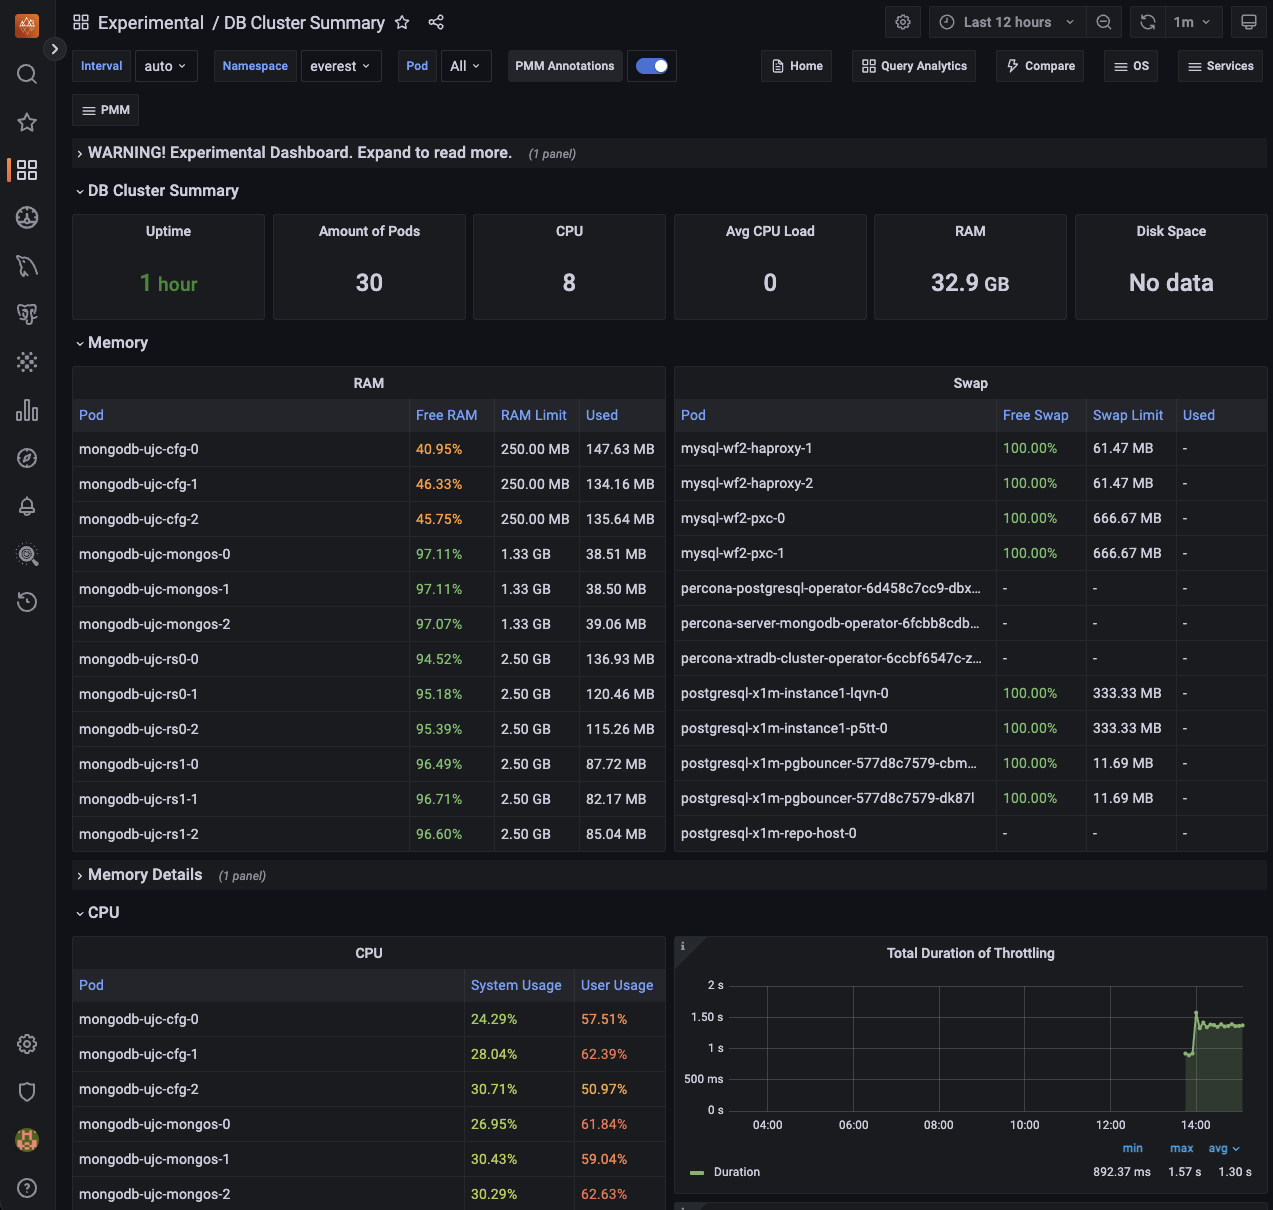
To see a comprehensive list of all the pods in the cluster along with their respective CPU and RAM usage statistics, go to Dashboards > Experimental > DB Cluster Summary. This provides insights into how your cluster performs and resources are allocated, enabling you to make informed decisions.
If you’re looking to dive deeper into the dashboard’s features and functionality, check out the PMM documentation.
Edit monitoring endpoint
To edit a monitoring endpoint from the Percona Everest UI:
-
From the Percona Everest Homepage, navigate to Settings > Monitoring endpoints.
-
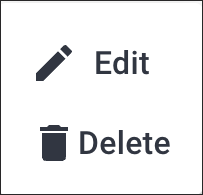
Click on the ellipsis (three dots) next to the endpoint you need to edit.
-
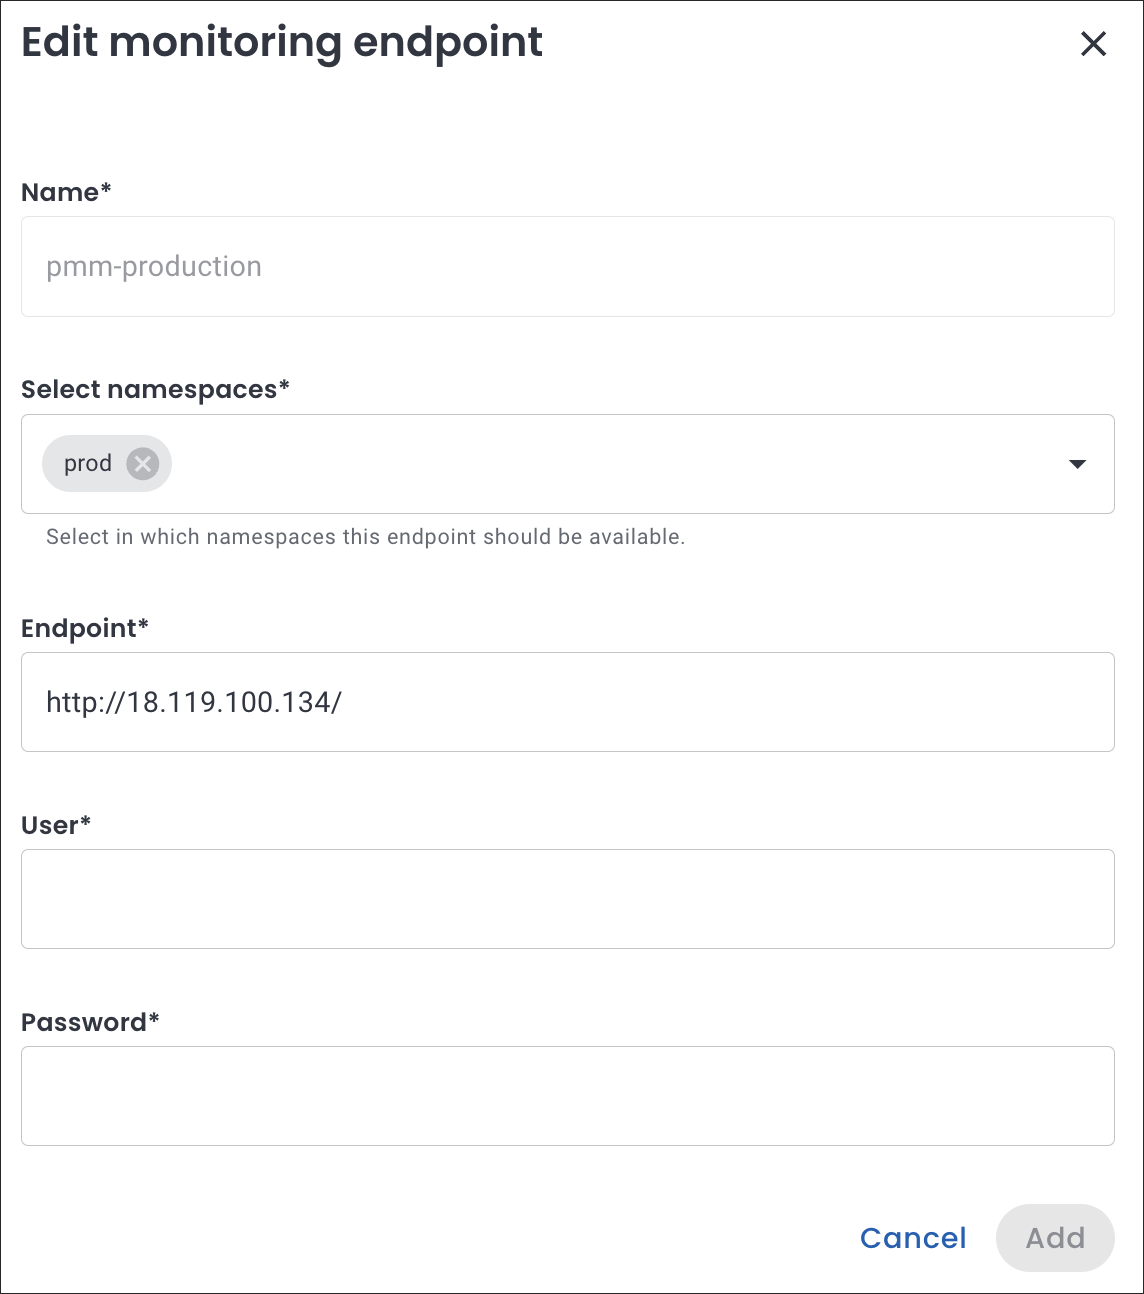
Click Edit. The Edit monitoring endpoint pop-up opens. In this dialogue box, edit the information as per your requirements.
-
Click Add.
Delete monitoring endpoint
To delete a monitoring endpoint from the Percona Everest UI:
-
From the Percona Everest Homepage, navigate to Settings > Monitoring endpoints.
-
Click on the ellipsis (three dots) next to the endpoint you need to delete.
-
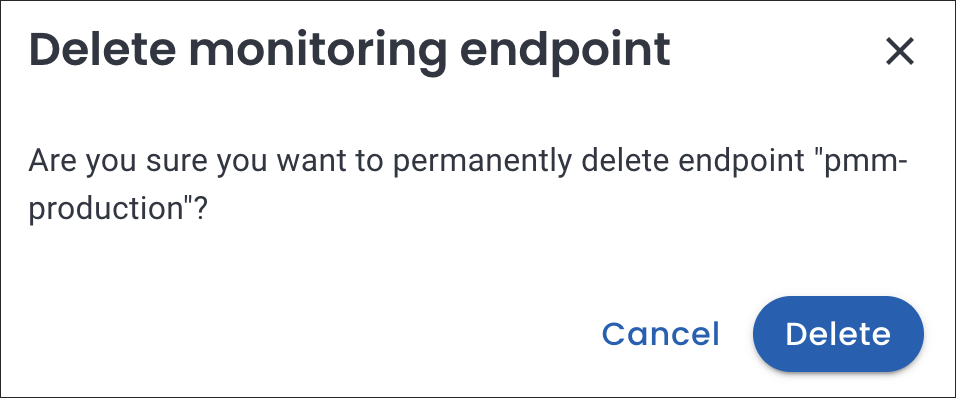
Click Delete. The Delete monitoring endpoint dialogue box opens.
-
Click Delete.