Monitoring the cluster
Each node can have a different view of the cluster. There is no centralized node to monitor. To track down the source of issues, you have to monitor each node independently.
Values of many variables depend on the node from which you are querying. For example, replication sent from a node and writes received by all other nodes.
Having data from all nodes can help you understand where flow messages are coming from, which node sends excessively large transactions, and so on.
Manual Monitoring
Manual cluster monitoring can be performed using myq-tools.
Alerting
Besides standard MySQL alerting, you should use at least the following triggers specific to Percona XtraDB Cluster:
- Cluster state of each node
wsrep_cluster_status != Primary
- Node state
wsrep_connected != ON
wsrep_ready != ON
For additional alerting, consider the following:
-
Excessive replication conflicts can be identtified using the
wsrep_local_cert_failuresandwsrep_local_bf_abortsvariables -
Excessive flow control messages can be identified using the
wsrep_flow_control_sentandwsrep_flow_control_recvvariables -
Large replication queues can be identified using the
wsrep_local_recv_queue.
Metrics
Cluster metrics collection for long-term graphing should be done at least for the following:
- Queue sizes:
wsrep_local_recv_queue and wsrep_local_send_queue
- Flow control:
wsrep_flow_control_sent and wsrep_flow_control_recv
- Number of transactions for a node:
wsrep_replicated and wsrep_received
- Number of transactions in bytes:
wsrep_replicated_bytes and wsrep_received_bytes
- Replication conflicts:
wsrep_local_cert_failures and wsrep_local_bf_aborts
Using Percona Monitoring and Management
Percona Monitoring and Management includes two dashboards to monitor PXC:
-
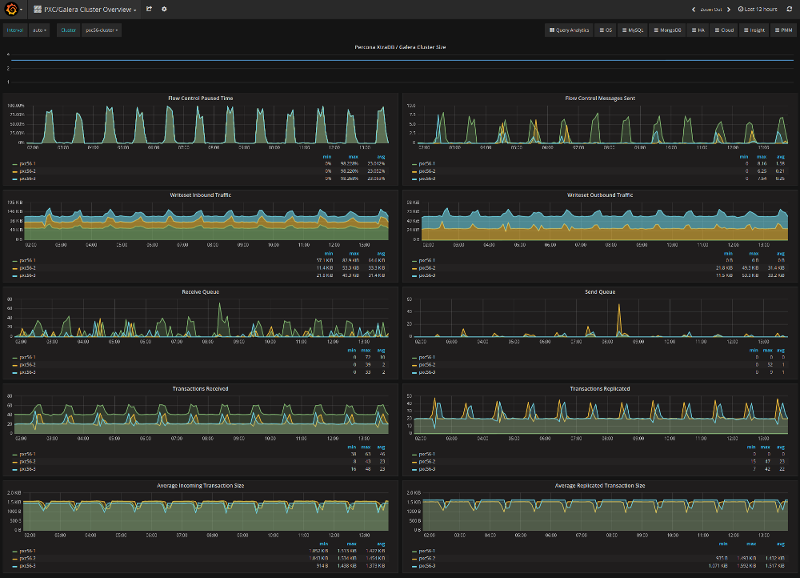
-
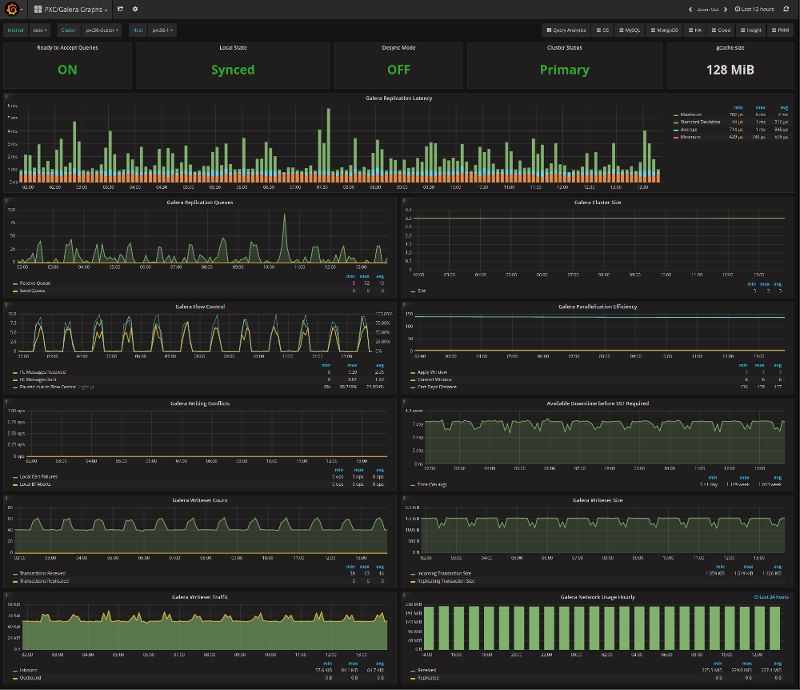
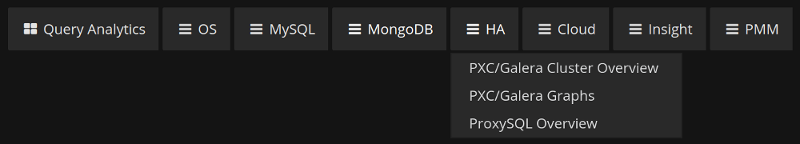
These dashboards are available from the menu:
Please refer to the official documentation for details on Percona Monitoring and Management installation and setup.