Monitor Kubernetes
Monitoring the state of the database is crucial to timely identify and react to performance issues. Percona Monitoring and Management (PMM) solution enables you to do just that.
However, the database state also depends on the state of the Kubernetes cluster itself. Hence it’s important to have metrics that can depict the state of the Kubernetes cluster.
This document describes how to set up monitoring of the Kubernetes cluster health. This setup has been tested with the PMM server as the centralized data storage and the Victoria Metrics Kubernetes monitoring stack as the metrics collector.
These steps may also apply if you use another Prometheus-compatible storage.
The Operator is compatible with both PMM versions 2 and 3. We recommend using the latest PMM version 3 for optimal monitoring capabilities.
The steps in this tutorial are for PMM 3.
Pre-requisites
To set up monitoring of Kubernetes, you need the following:
-
PMM Server up and running. You can run PMM Server as a Docker image, a virtual appliance, or on an AWS instance. Please refer to the official PMM documentation for the installation instructions of PMM 3.
See PMM upgrade documentation for how you can upgrade to PMM3. Also check the Automatic migration of API keys page.
-
Helm v3 .
- kubectl .
- PMM 3 Service account token or PMM2 API key.
Configure authentication
PMM3 uses Grafana service accounts to control access to PMM server components and resources. To authenticate in PMM server, you need a service account token. Generate a service account and token . Specify the Admin role for the service account.
The token must have the format glsa_*************************_9e35351b.
Warning
When you create a service account token, you can select its lifetime: it can be either a permanent token that never expires or the one with the expiration date. PMM server cannot rotate service account tokens after they expire. So you must take care of reconfiguring PMM Client in this case.
Get the PMM API key from PMM Server . The API key must have the role “Admin”. You need this key to authorize PMM Client within PMM Server.
You can query your PMM Server installation for the API
Key using curl and jq utilities. Replace <login>:<password>@<server_host> placeholders with your real PMM Server login, password, and hostname in the following command:
API_KEY=$(curl --insecure -X POST -H "Content-Type: application/json" -d '{"name":"operator", "role": "Admin"}' "https://<login>:<password>@<server_host>/graph/api/auth/keys" | jq .key)
Warning
The API key is not rotated.
Install the Victoria Metrics Kubernetes monitoring stack
-
To install the Victoria Metrics Kubernetes monitoring stack with the default parameters, use the quick install command. Replace the following placeholders with your values:
PMM-SERVER-TOKEN- The PMM Server service account tokenPMM-SERVER-URL- The URL to access the PMM ServerUNIQUE-K8s-CLUSTER-IDENTIFIER- Identifier for the Kubernetes cluster. It can be the name you defined during the cluster creation.
You should use a unique identifier for each Kubernetes cluster. The use of the same identifier for more than one Kubernetes cluster will result in the conflicts during the metrics collection.
NAMESPACE- The namespace where the Victoria metrics Kubernetes stack will be installed. If you haven’t created the namespace before, it will be created during the command execution.
We recommend to use a separate namespace like
monitoring-system.curl -fsL https://raw.githubusercontent.com/Percona-Lab/k8s-monitoring/refs/tags/v0.1.3/vm-operator-k8s-stack/quick-install.sh | bash -s -- --api-key <PMM-SERVER-TOKEN> --pmm-server-url <PMM-SERVER-URL> --k8s-cluster-id <UNIQUE-K8s-CLUSTER-IDENTIFIER> --namespace <NAMESPACE>Note
The Prometheus node exporter is not installed by default since it requires privileged containers with the access to the host file system. If you need the metrics for Nodes, add the
--node-exporter-enabledflag as follows:curl -fsL https://raw.githubusercontent.com/Percona-Lab/k8s-monitoring/refs/tags/v0.1.3/vm-operator-k8s-stack/quick-install.sh | bash -s -- --api-key <PMM-SERVER-TOKEN> --pmm-server-url <PMM-SERVER-URL> --k8s-cluster-id <UNIQUE-K8s-CLUSTER-IDENTIFIER> --namespace <NAMESPACE> --node-exporter-enabledNote
When installing the chart on OpenShift, some components might require additional Security Context Constraints (SCCs), depending on the permissions they need at runtime.
The
prometheus-node-exportercomponent runs as a DaemonSet and requires access to host-level resources such as/proc,/sys, and other node-level paths. Because these are exposed throughhostPathmounts, the service account used byprometheus-node-exportermust be granted an SCC that allows host access, such ashostaccess,hostmount-anyuid, or a custom SCC with equivalent permissions.For example:
oc adm policy add-scc-to-user node-exporter \
-z prometheus-node-exporter \
-n <namespace>
Similarly, for
kube-state-metrics, if therestrictedSCC is enforced, avoid setting fixed user, group, or filesystem group IDs. Allow OpenShift to assign these values from the namespace UID/GID range by either adding the service account to the required SCC or by adding the following entries to the values YAML file:kube-state-metrics: securityContext: runAsUser: null runAsGroup: null fsGroup: null
You may need to customize the default parameters of the Victoria metrics Kubernetes stack.
- Since we use the PMM Server for monitoring, there is no need to store the data in Victoria Metrics Operator. Therefore, the Victoria Metrics Helm chart is installed with the
vmsingle.enabledandvmcluster.enabledparameters set tofalsein this setup. - Check all the role-based access control (RBAC) rules of the
victoria-metrics-k8s-stackchart and the dependencies chart, and modify them based on your requirements.
Configure authentication in PMM
To access the PMM Server resources and perform actions on the server, configure authentication.
-
Encode the PMM Server token key with base64.
$ echo -n <API-key> | base64 --wrap=0echo -n <API-key> | base64 -
Create the Namespace where you want to set up monitoring. The following command creates the Namespace
monitoring-system. You can specify a different name. In the latter steps, specify your namespace instead of the<namespace>placeholder.kubectl create namespace monitoring-system -
Create the YAML file for the Kubernetes Secrets and specify the base64-encoded API key value within. Let’s name this file
pmm-api-vmoperator.yaml.pmm-api-vmoperator.yamlapiVersion: v1 data: api_key: <base-64-encoded-pmm-server-token> kind: Secret metadata: name: pmm-token-vmoperator #namespace: default type: Opaque -
Create the Secrets object using the YAML file you created previously. Replace the
<filename>placeholder with your value.kubectl apply -f pmm-api-vmoperator.yaml -n <namespace> -
Check that the secret is created. The following command checks the secret for the resource named
pmm-token-vmoperator(as defined in themetadata.nameoption in the secrets file). If you defined another resource name, specify your value.
kubectl get secret pmm-token-vmoperator -n <namespace>
Create a ConfigMap to mount for kube-state-metrics
The kube-state-metrics (KSM) is a simple service that listens to the Kubernetes API server and generates metrics about the state of various objects - Pods, Deployments, Services and Custom Resources.
To define what metrics the kube-state-metrics should capture, create the ConfigMap and mount it to a container.
Use the example configmap.yaml configuration file to create the ConfigMap.
kubectl apply -f https://raw.githubusercontent.com/Percona-Lab/k8s-monitoring/refs/tags/v0.1.3/vm-operator-k8s-stack/ksm-configmap.yaml -n <namespace>
As a result, you have the customresource-config-ksm ConfigMap created.
Install the Victoria Metrics Kubernetes monitoring stack
-
Add the dependency repositories of victoria-metrics-k8s-stack chart.
helm repo add grafana https://grafana.github.io/helm-charts helm repo add prometheus-community https://prometheus-community.github.io/helm-charts -
Add the Victoria Metrics Kubernetes monitoring stack repository.
helm repo add vm https://victoriametrics.github.io/helm-charts/ -
Update the repositories.
helm repo update -
Install the Victoria Metrics Kubernetes monitoring stack Helm chart. You need to specify the following configuration:
- the URL to access the PMM server in the
externalVM.write.urloption in the format<PMM-SERVER-URL>/victoriametrics/api/v1/write. The URL can contain either the IP address or the hostname of the PMM server. - the unique name or an ID of the Kubernetes cluster in the
vmagent.spec.externalLabels.k8s_cluster_idoption. Ensure to set different values if you are sending metrics from multiple Kubernetes clusters to the same PMM Server. - the
<namespace>placeholder with your value. The Namespace must be the same as the Namespace for the Secret and ConfigMap
helm install vm-k8s vm/victoria-metrics-k8s-stack \
-f https://raw.githubusercontent.com/Percona-Lab/k8s-monitoring/refs/tags/v0.1.3/vm-operator-k8s-stack/values.yaml \
--set external.vm.write.url=<PMM-SERVER-URL>/victoriametrics/api/v1/write \
--set vmagent.spec.externalLabels.k8s_cluster_id=<UNIQUE-CLUSTER-IDENTIFIER/NAME> \
-n <namespace>
To illustrate, say your PMM Server URL is
https://pmm-example.com, the cluster ID istest-clusterand the Namespace ismonitoring-system. Then the command would look like this:$ helm install vm-k8s vm/victoria-metrics-k8s-stack \ -f https://raw.githubusercontent.com/Percona-Lab/k8s-monitoring/refs/tags/v0.1.3/vm-operator-k8s-stack/values.yaml \ --set externalVM.write.url=https://pmm-example.com/victoriametrics/api/v1/write \ --set vmagent.spec.externalLabels.k8s_cluster_id=test-cluster \ -n monitoring-system - the URL to access the PMM server in the
Validate the successful installation
kubectl get pods -n <namespace>
Sample output
vm-k8s-stack-kube-state-metrics-d9d85978d-9pzbs                   1/1     Running   0          28m
vm-k8s-stack-victoria-metrics-operator-844d558455-gvg4n           1/1     Running   0          28m
vmagent-vm-k8s-stack-victoria-metrics-k8s-stack-55fd8fc4fbcxwhx   2/2     Running   0          28m
What Pods are running depends on the configuration chosen in values used while installing victoria-metrics-k8s-stack chart.
Verify metrics capture
- Connect to the PMM server.
- Click Explore and switch to the Code mode.
-
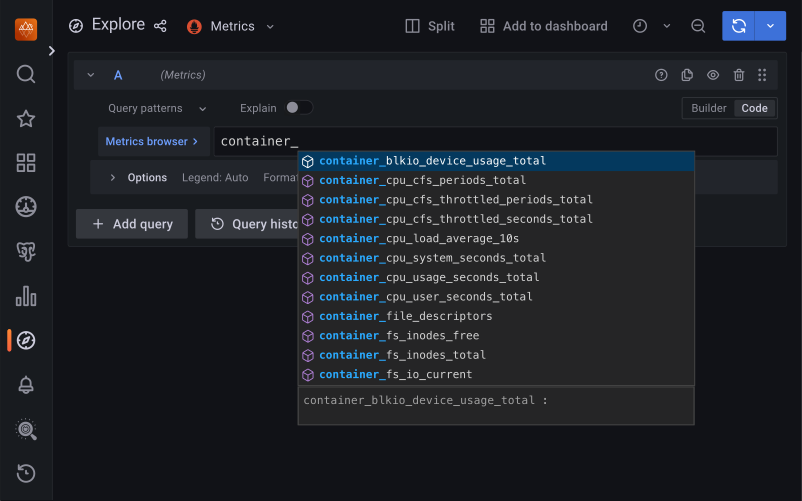
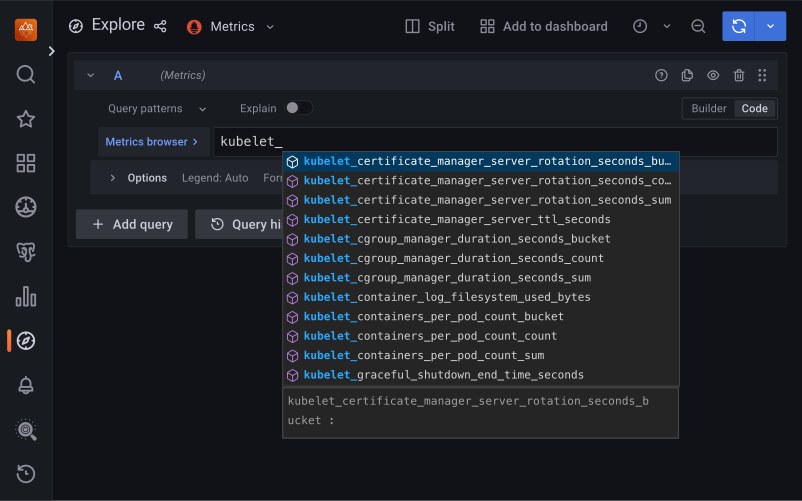
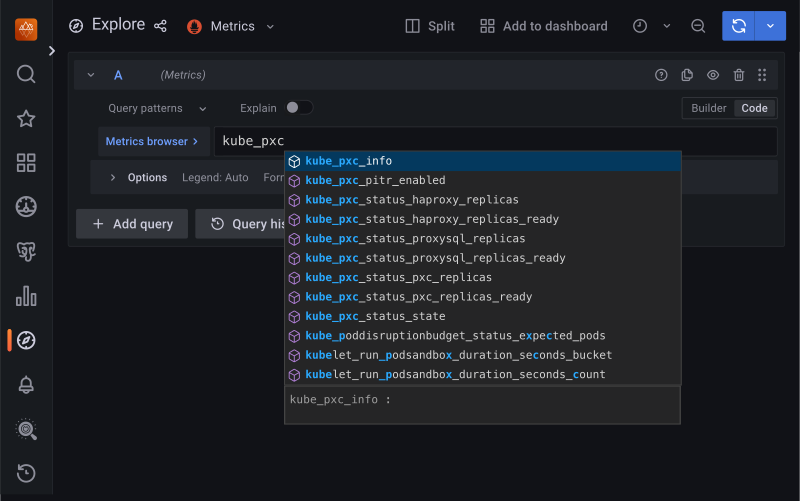
Check that the required metrics are captured, type the following in the Metrics browser dropdown:
- cadvisor :
- kubelet:
- kube-state-metrics metrics that also include Custom resource metrics for the Operator and database deployed in your Kubernetes cluster:
Uninstall Victoria metrics Kubernetes stack
To remove Victoria metrics Kubernetes stack used for Kubernetes cluster monitoring, use the cleanup script. By default, the script removes all the Custom Resource Definitions(CRD) and Secrets associated with the Victoria metrics Kubernetes stack. To keep the CRDs, run the script with the --keep-crd flag.
Replace the <NAMESPACE> placeholder with the namespace you specified during the Victoria metrics Kubernetes stack installation:
bash <(curl -fsL https://raw.githubusercontent.com/Percona-Lab/k8s-monitoring/refs/tags/v0.1.3/vm-operator-k8s-stack/cleanup.sh) --namespace <NAMESPACE>
Replace the <NAMESPACE> placeholder with the namespace you specified during the Victoria metrics Kubernetes stack installation:
bash <(curl -fsL https://raw.githubusercontent.com/Percona-Lab/k8s-monitoring/refs/tags/v0.1.3/vm-operator-k8s-stack/cleanup.sh) --namespace <NAMESPACE> --keep-crd
Check that the Victoria metrics Kubernetes stack is deleted:
helm list -n <namespace>
The output should provide the empty list.
If you face any issues with the removal, uninstall the stack manually:
helm uninstall vm-k8s-stack -n <namespace>
Created: September 6, 2023