PMM architecture
Percona Monitoring and Management (PMM) is a client/server application. PMM Client collects metrics and query data from the systems that you monitor and sends them to PMM Server. PMM Server stores the data and presents it in its web interface.

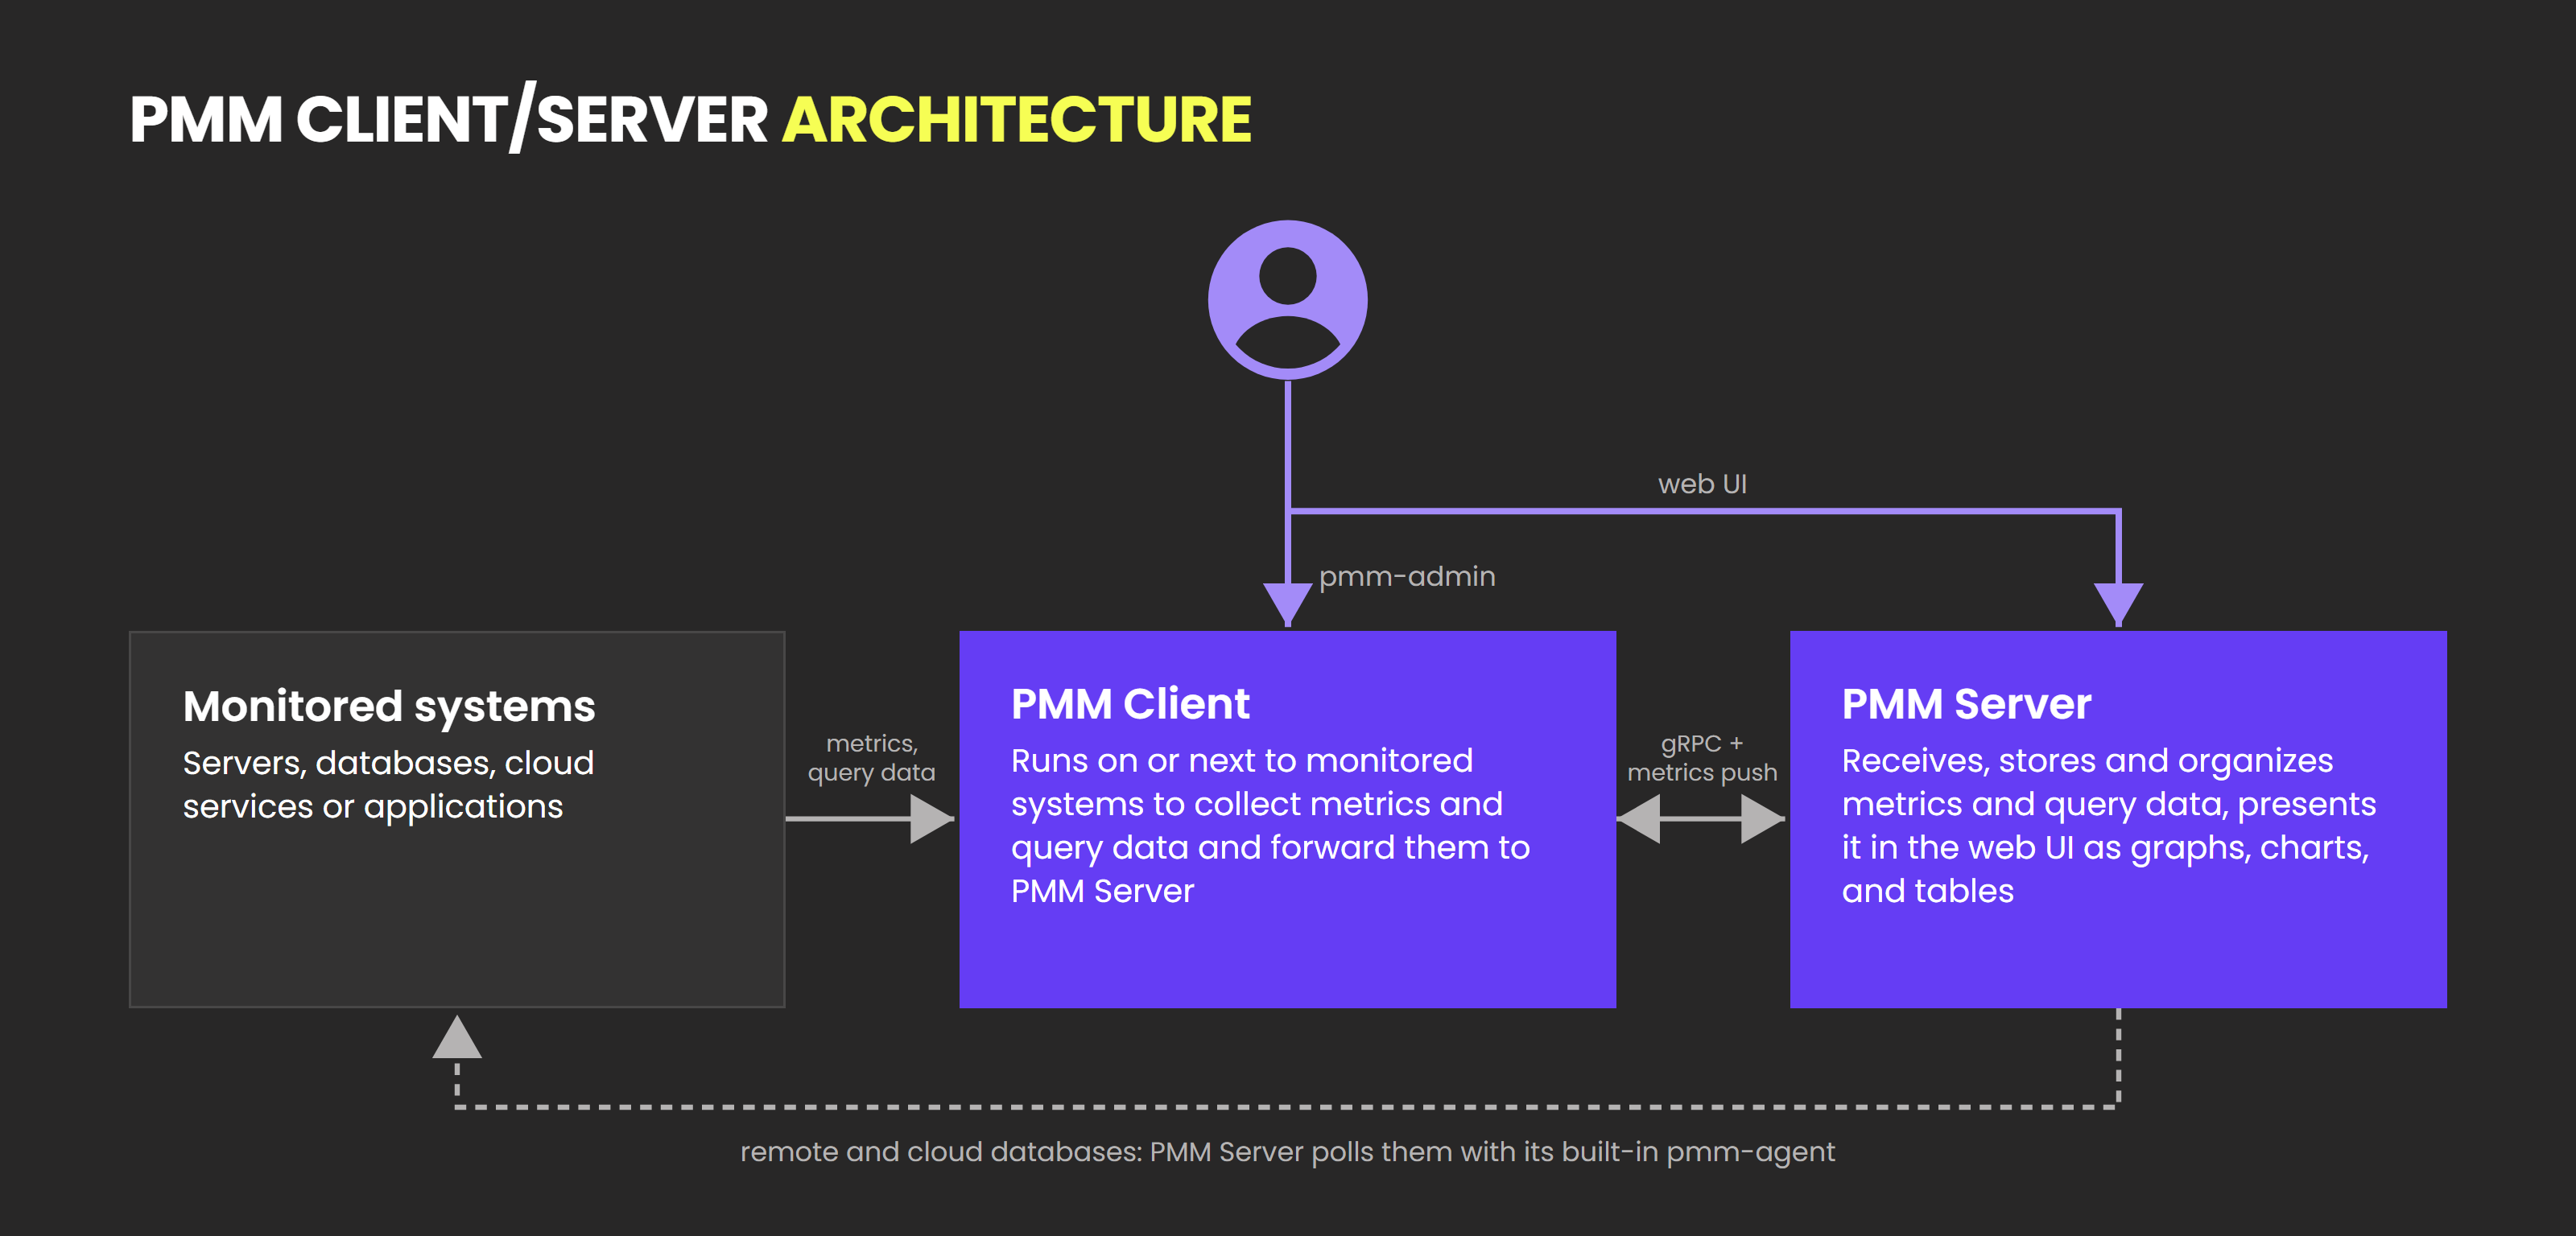
You can also monitor remote databases and cloud services, such as Amazon RDS and Azure, without installing PMM Client on their hosts. In that case, the pmm-agent built into PMM Server, or a PMM Client on another host, collects the data. For details, see Connect remote instance to PMM.
PMM Server
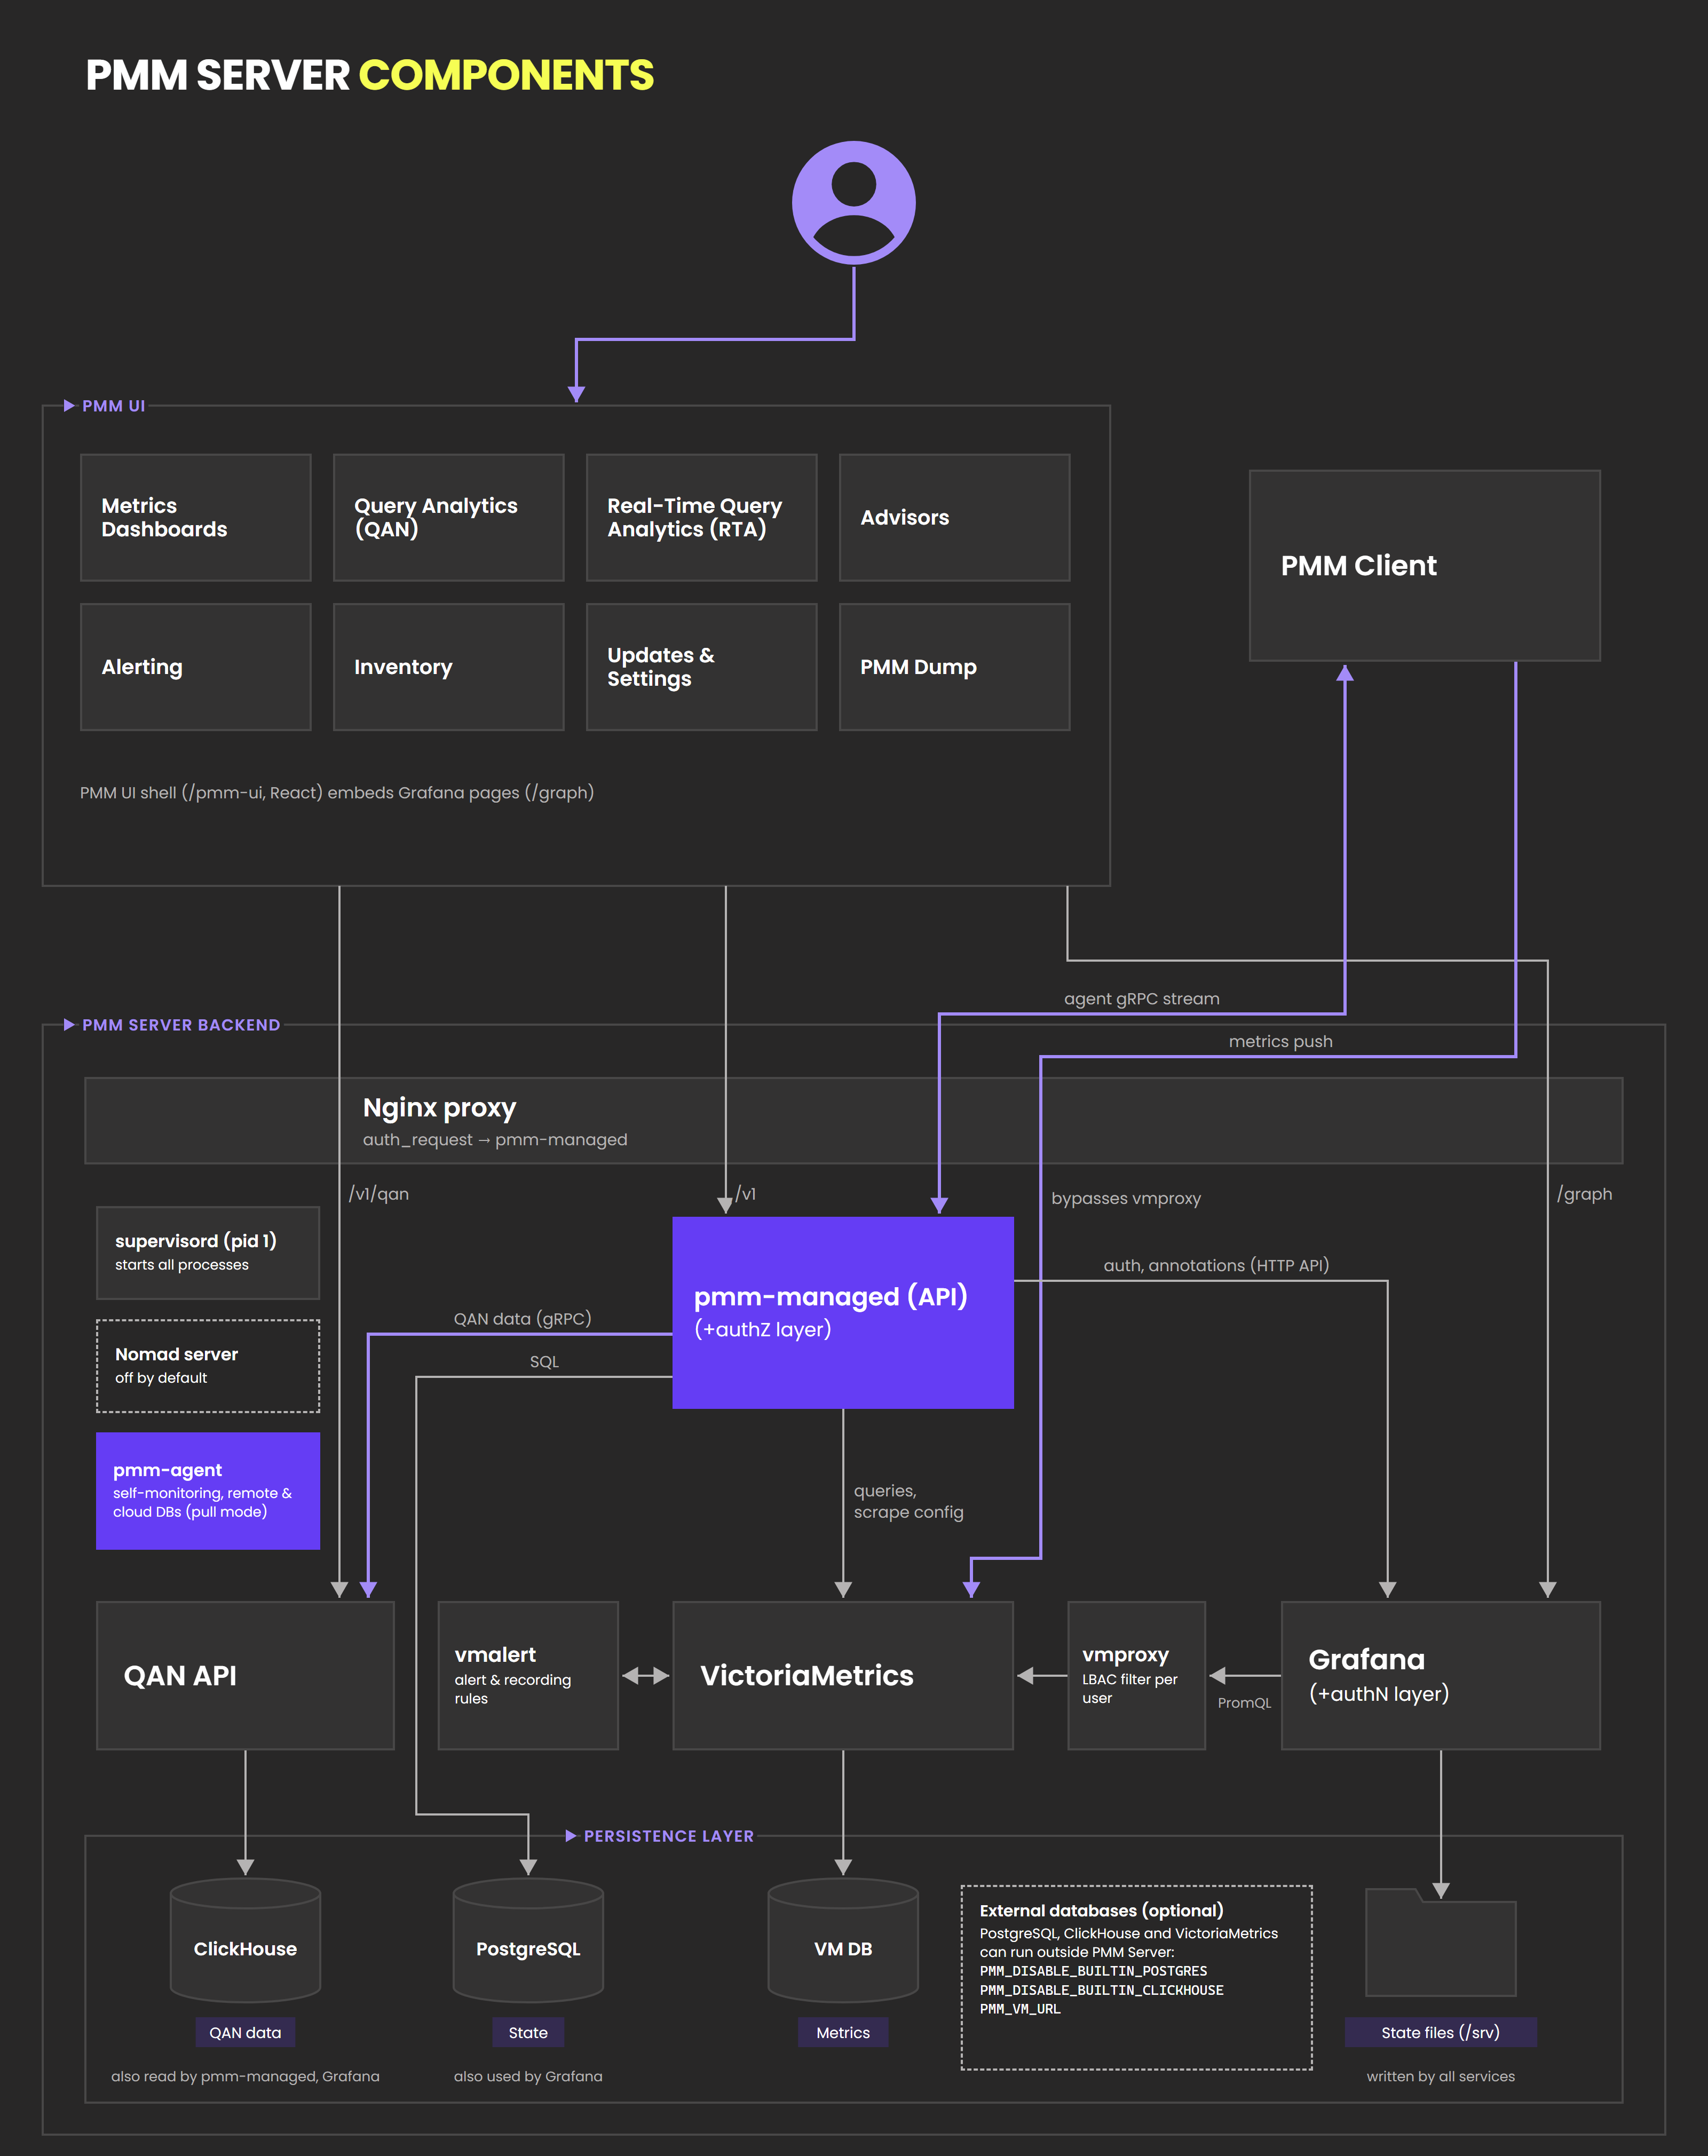
PMM Server receives data from PMM Clients, stores it, and presents it in dashboards and other views of the web interface. In a standard deployment, PMM Server runs as a single container that holds all of the components in this section.

Web interface
The web interface, also called the PMM UI, is a web application that embeds Grafana. It brings together Metrics Dashboards, Query Analytics (QAN), Real-Time Query Analytics (RTA) for MongoDB, Advisors, Alerting, Inventory, Updates & Settings, and PMM Dump.
Server components
PMM Server runs the following services:
- Nginx receives every request, on port 8443 (HTTPS) or 8080 (HTTP) inside the container. You usually publish port 8443 as 443. It asks
pmm-managedto authorize requests, then routes them to the other services. pmm-managedmanages the PMM Server configuration, the inventory of monitored services, and the connected PMM Clients. It forwards QAN data from PMM Clients to QAN API, and keeps RTA data in memory.- QAN API stores and serves Query Analytics data.
- VictoriaMetrics stores metrics. It receives the metrics that PMM Clients push, and scrapes exporters that run in pull mode.
- vmproxy applies label-based access control (LBAC) filters to metrics queries before they reach VictoriaMetrics.
- vmalert evaluates alerting and recording rules against VictoriaMetrics.
- Grafana renders dashboards, runs Alerting, and authenticates users.
PMM Server also runs these supporting processes:
- supervisord runs as process 1, and starts and restarts every other process.
pmm-agentmonitors PMM Server itself, and collects data from remote databases and cloud services in pull mode.- Nomad server runs the Nomad workload orchestrator for future PMM extensions. It’s disabled by default.
Persistence layer
PMM Server keeps its data in the following stores:
- ClickHouse stores Query Analytics data.
pmm-managedand Grafana also read from it. - PostgreSQL stores the
pmm-managedstate and the Grafana database. - VM DB, the VictoriaMetrics storage, holds metrics.
- State files under
/srvhold configuration, logs and, when you use the built-in databases, all stored data.
You can run PostgreSQL, ClickHouse and VictoriaMetrics outside PMM Server. For details, see external PostgreSQL, external ClickHouse and external VictoriaMetrics, which is in Technical Preview. To run more than one PMM Server instance, see Install PMM in High Availability (HA) mode.
PMM Client
PMM Client is a set of programs that runs on, or next to, each system that you monitor. It collects metrics and query data, and sends them to PMM Server. To install it, see PMM Client installation overview.

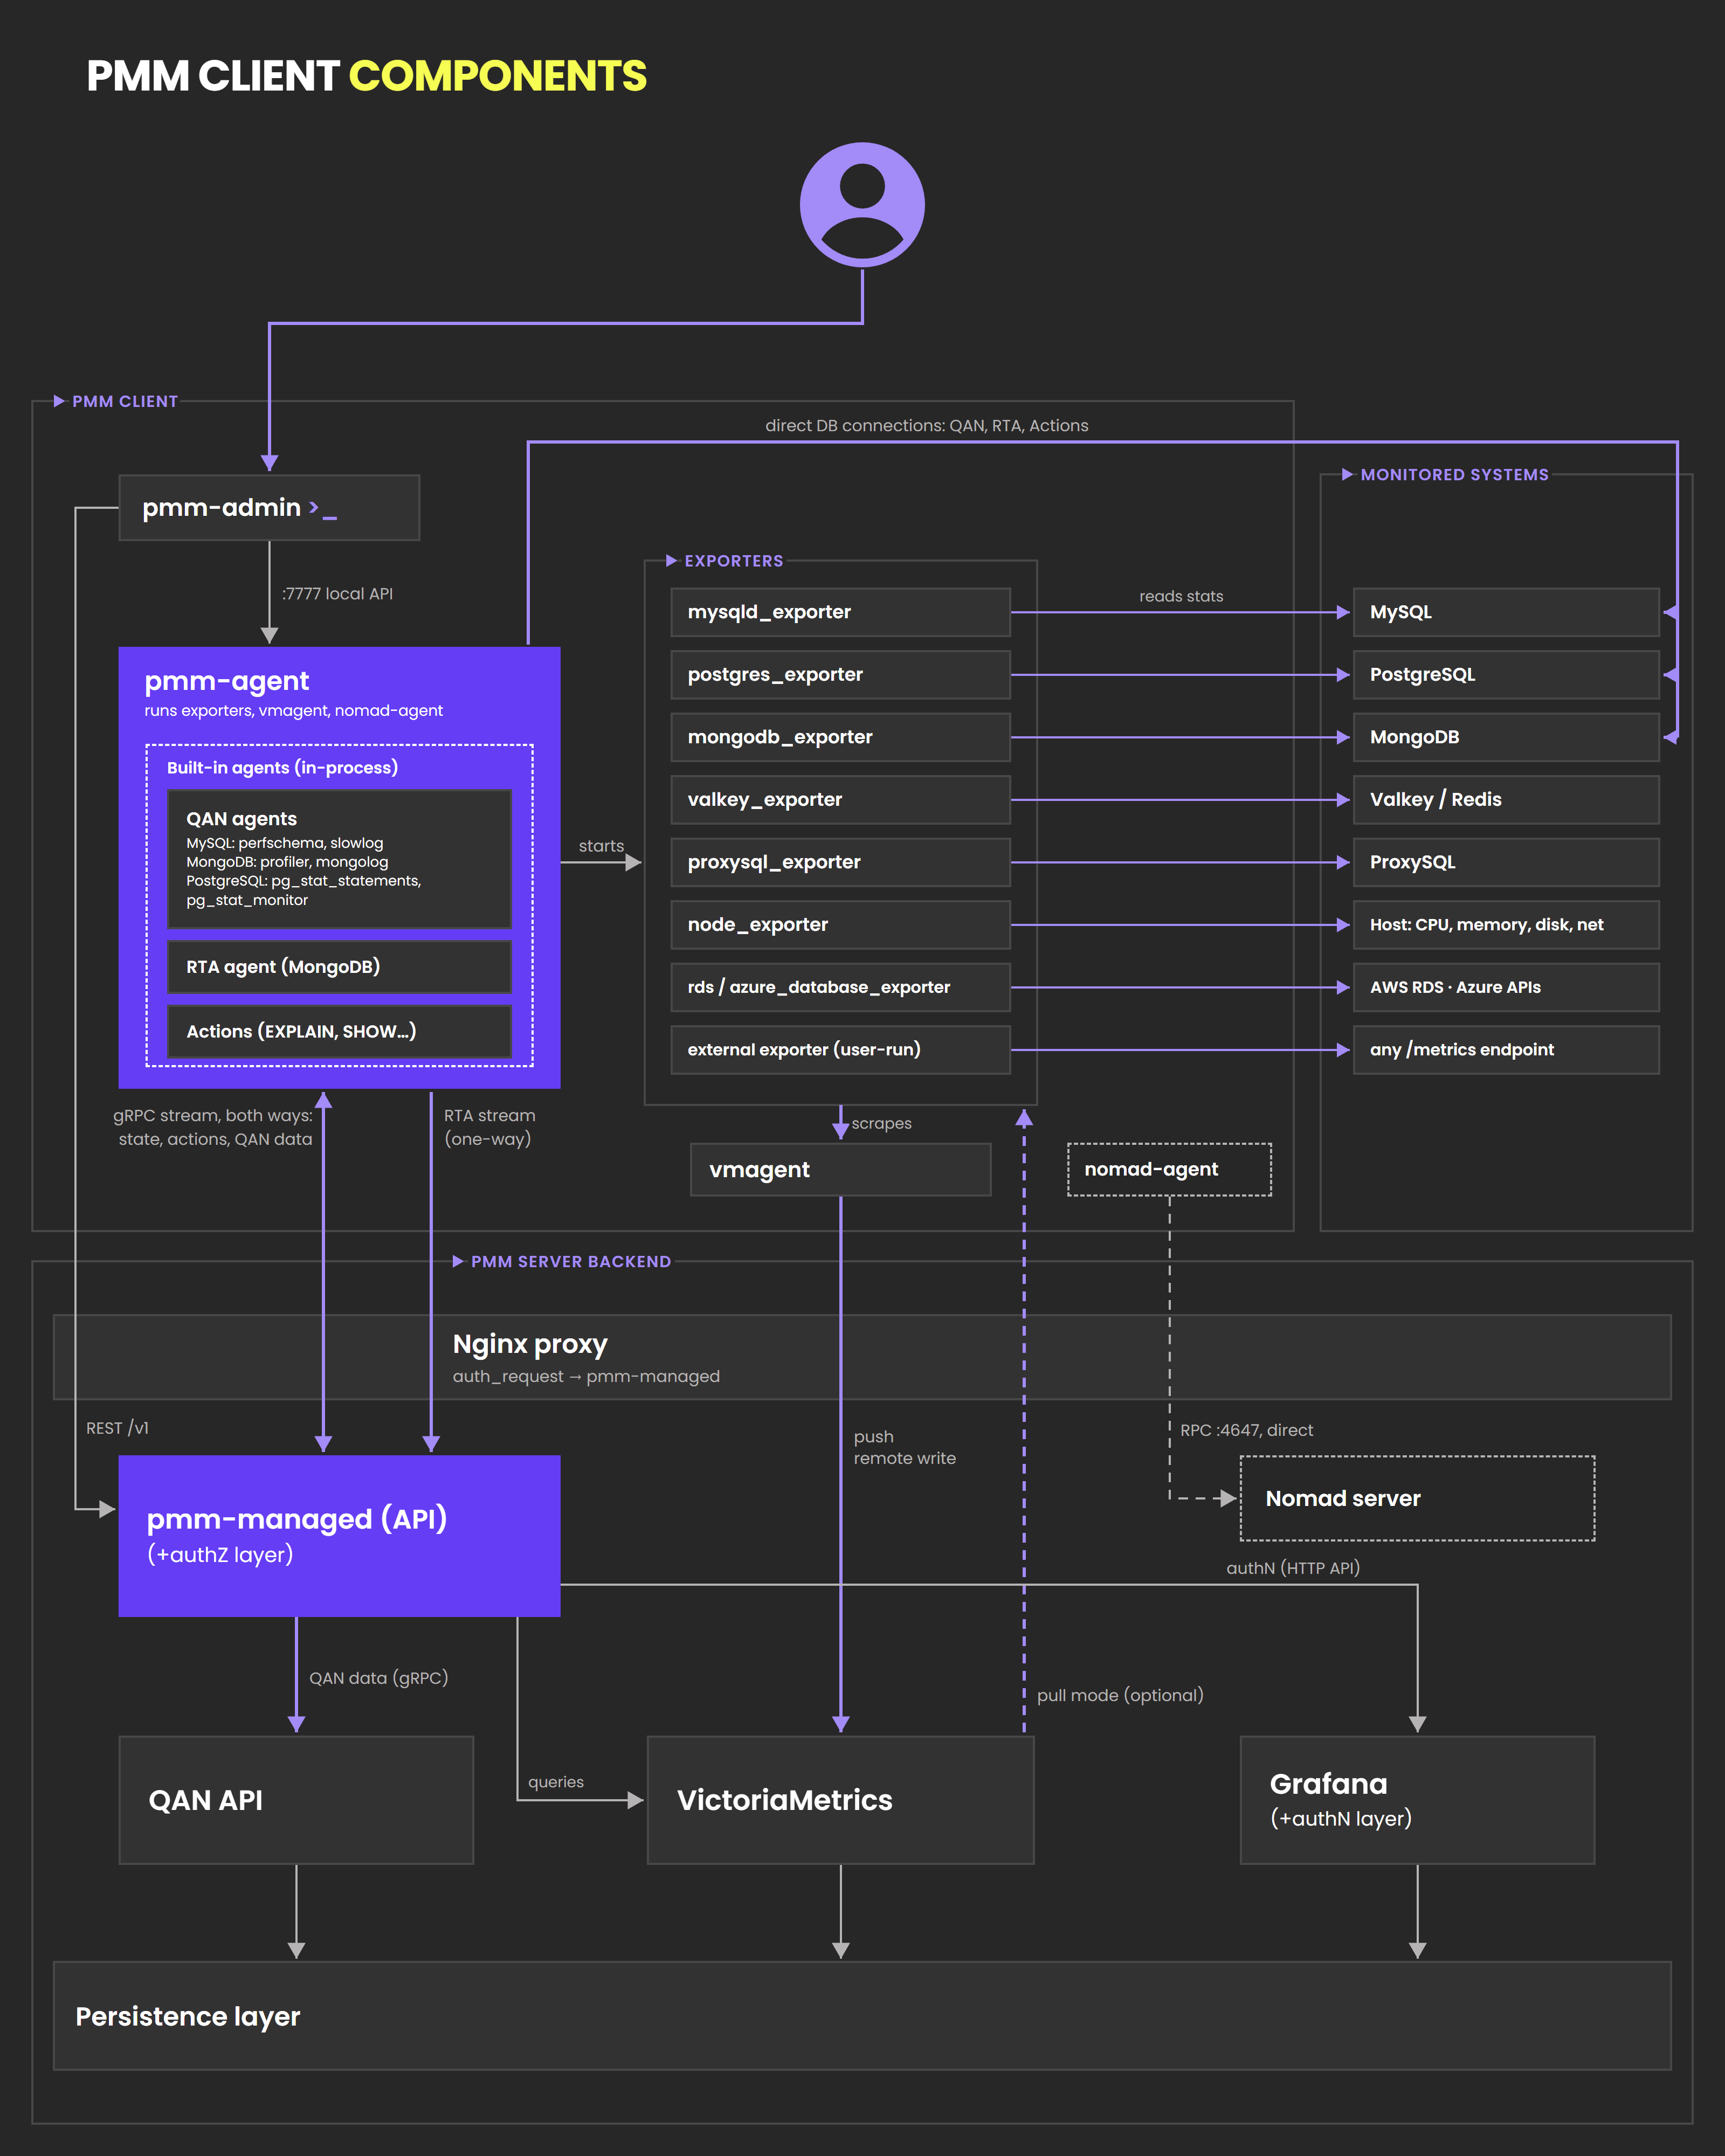
PMM Client includes the following components:
pmm-adminis the command-line tool for adding and removing monitored services. It talks to the localpmm-agenton port 7777 and to the PMM Server API.pmm-agentis the daemon that connects PMM Client to PMM Server. It receives its configuration from PMM Server, then starts and stops the exporters and other agents.- Exporters collect metrics from each monitored service and expose them for scraping.
vmagentscrapes the local exporters and pushes the metrics to PMM Server in push mode, the default.- Built-in agents run inside the
pmm-agentprocess, and collect query data or run on-demand tasks. nomad-agentconnects to the Nomad server when you enable Nomad.
Exporters
PMM Client includes an exporter for each supported service type:
| Exporter | Collects metrics from |
|---|---|
node_exporter |
The host: CPU, memory, disk and network |
mysqld_exporter |
MySQL |
postgres_exporter |
PostgreSQL |
mongodb_exporter |
MongoDB |
valkey_exporter |
Valkey and Redis |
proxysql_exporter |
ProxySQL |
rds_exporter |
Amazon RDS, through Amazon CloudWatch |
azure_database_exporter |
Azure databases, through Azure Monitor |
You can also add an external exporter that you run yourself. PMM scrapes it like any other exporter.
Built-in agents
pmm-agent runs the following agents in its own process:
- QAN agents collect query data from MySQL (Performance Schema, slow query log), PostgreSQL (
pg_stat_statements,pg_stat_monitor) and MongoDB (profiler, log file). - The RTA agent streams the queries that are running on MongoDB right now.
- Actions run on-demand tasks, such as
EXPLAIN,SHOW CREATE TABLEandpt-summary.
How PMM Client and PMM Server interact
The following diagram shows the connections between the PMM Client and PMM Server components.

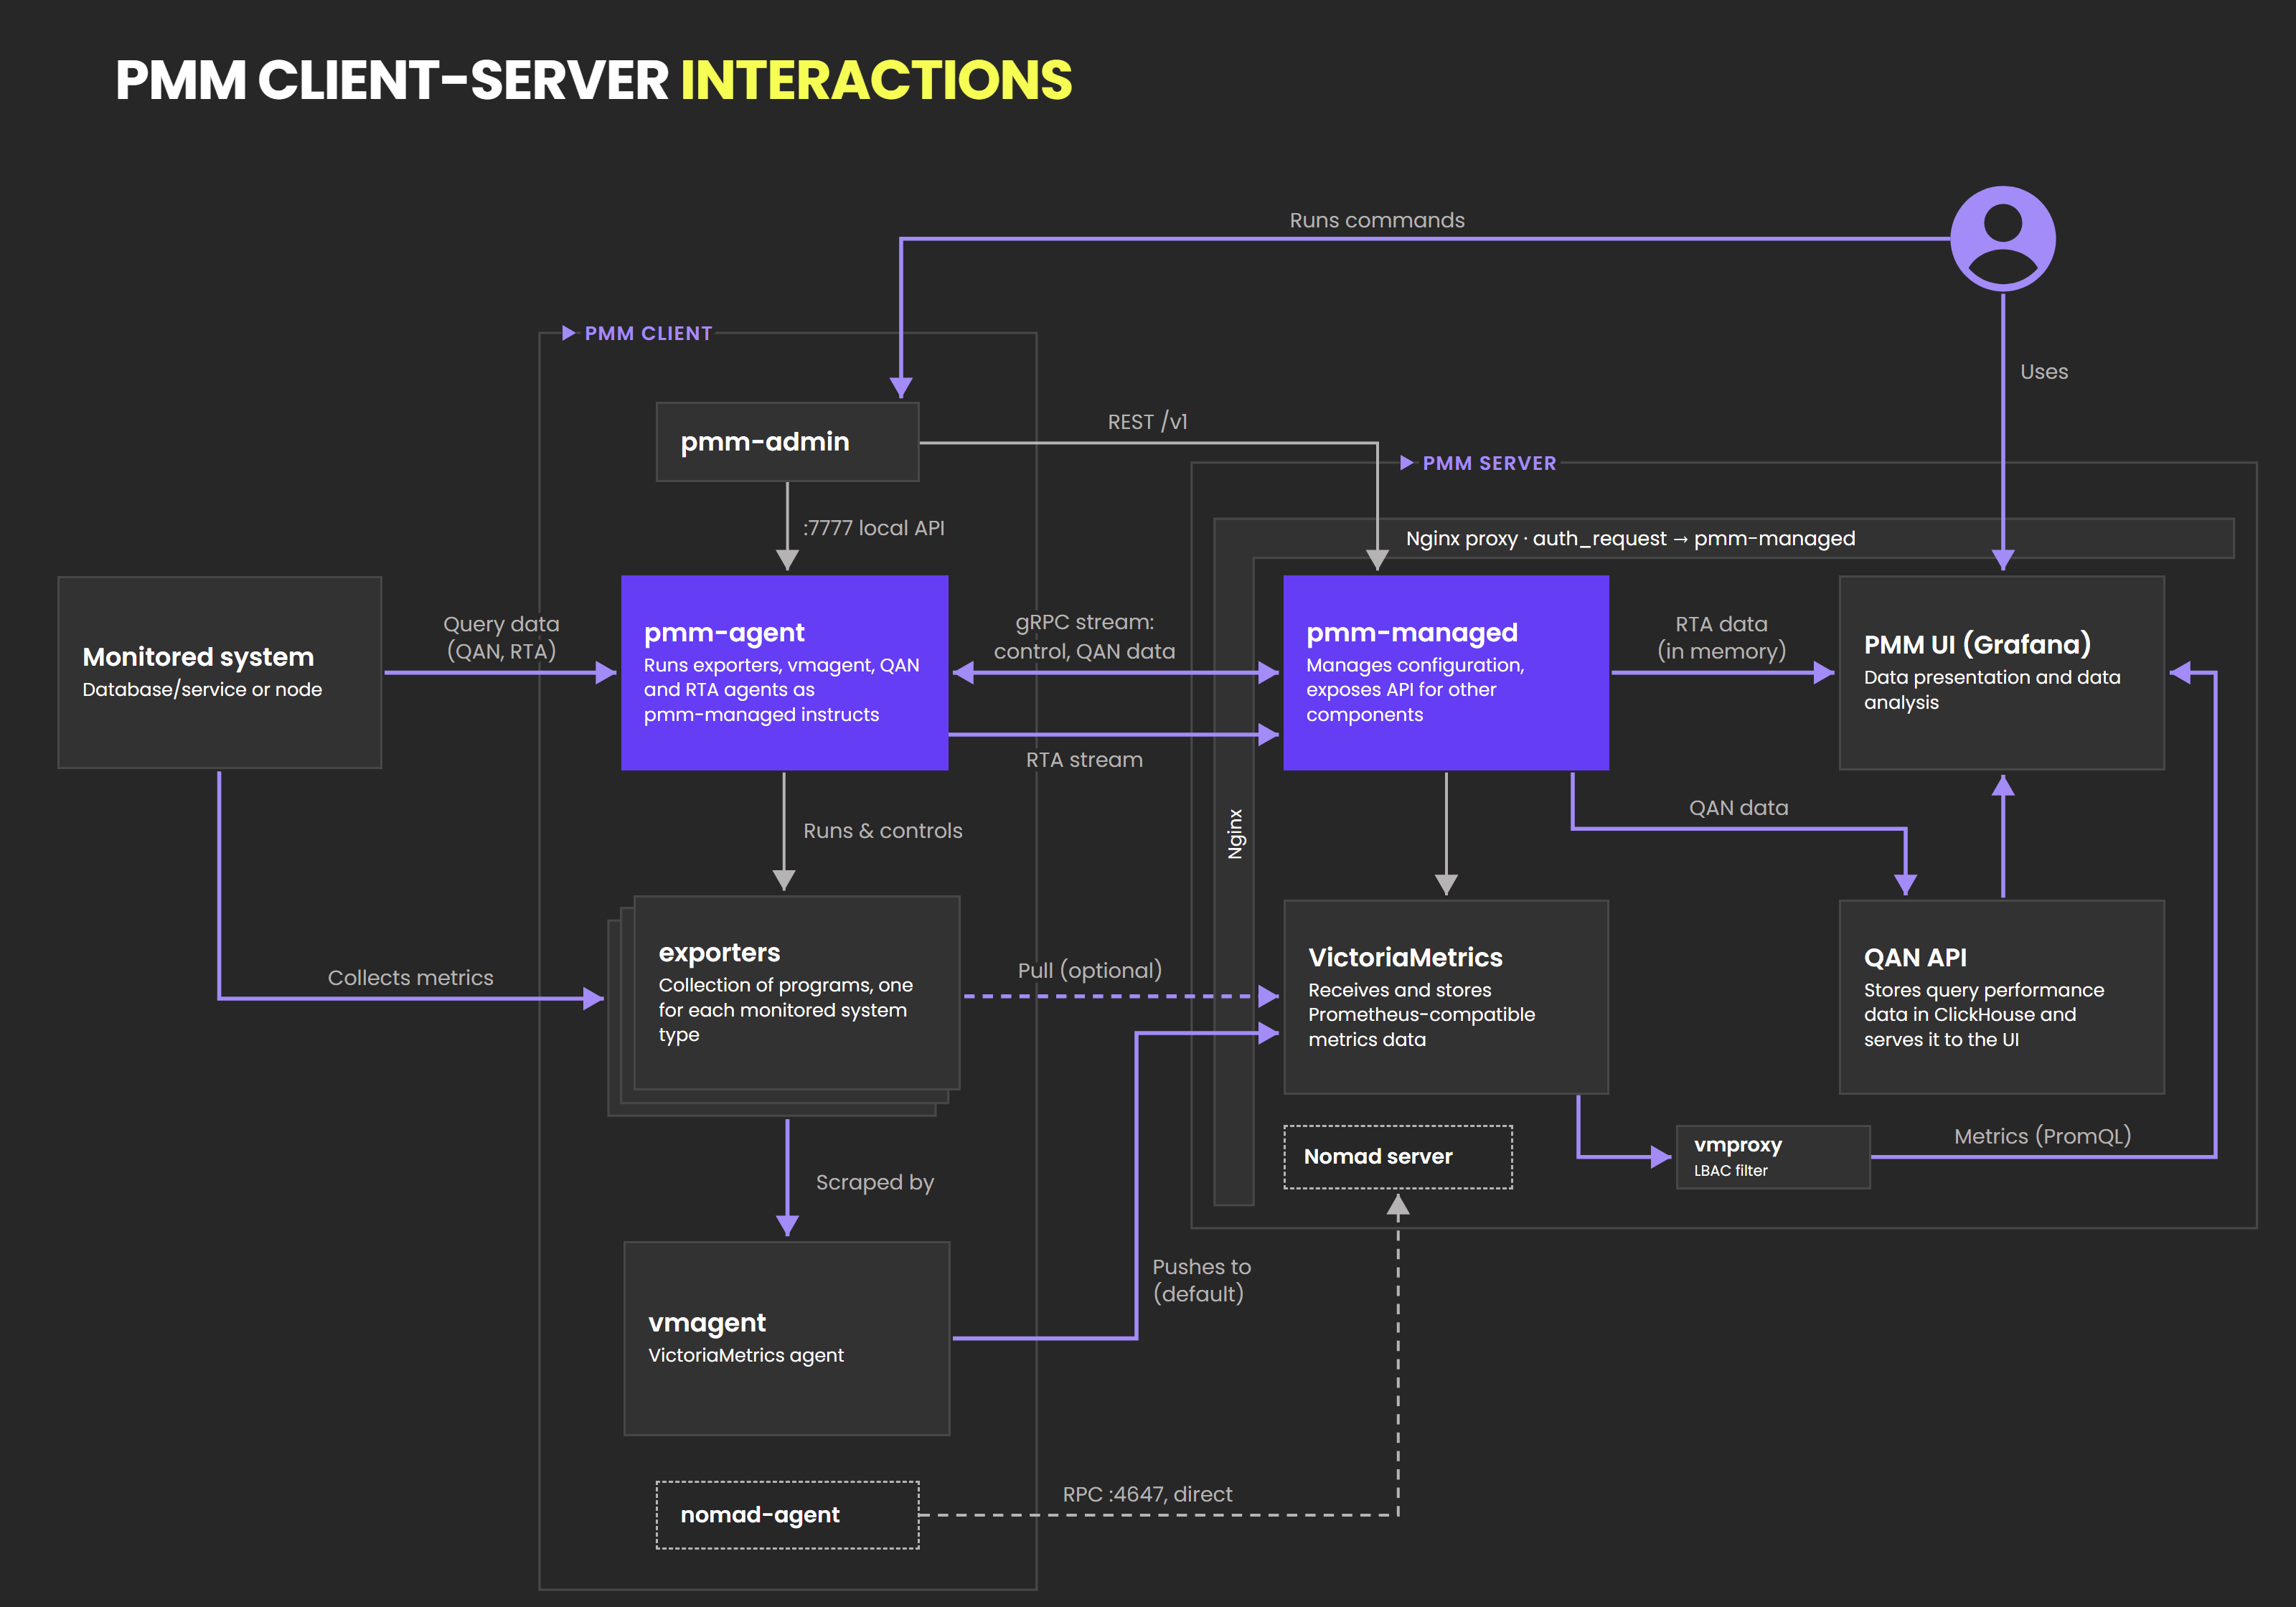
PMM Client and PMM Server communicate over these connections:
- Control stream:
pmm-agentkeeps a two-way gRPC stream open topmm-managed.pmm-managedsends configuration and on-demand actions, andpmm-agentsends status and QAN data. RTA data travels on a separate gRPC stream. - Metrics in push mode (default):
vmagentscrapes the local exporters and pushes the metrics to VictoriaMetrics. - Metrics in pull mode: VictoriaMetrics scrapes each exporter directly. To choose the mode, use the
--metrics-modeflag. For details, see Push/Pull modes. - Commands:
pmm-admincalls the localpmm-agenton port 7777 and the PMM Server API.
Inside PMM Server, the web interface reads metrics from VictoriaMetrics through vmproxy, and query data from QAN API. It reads RTA data from pmm-managed, which keeps that data in memory only.
Connection security
By default, pmm-agent and vmagent connect to PMM Server over HTTPS, on port 443 or 8443. Nomad RPC doesn’t use HTTPS, but it’s encrypted with TLS, using certificates that PMM Server generates. pmm-admin uses HTTP if you give it an http:// server URL. If you expose port 8080, Nginx serves API routes over HTTP without redirecting to HTTPS, so use HTTPS for authenticated requests. For development and testing only, the without-tls setting makes pmm-agent and vmagent send data and credentials unencrypted. To use your own certificates, see SSL encryption.
node_exporter, mysqld_exporter, postgres_exporter, mongodb_exporter and proxysql_exporter require HTTP basic authentication, each with its own password by default. valkey_exporter, rds_exporter and azure_database_exporter don’t require authentication. In pull mode, VictoriaMetrics connects to the exporters directly, on ports 42000–51999 by default, so PMM Server must be able to reach those ports. When you enable Nomad, nomad-agent also connects to PMM Server directly, on port 4647.
Exporters and QAN agents can use TLS to connect to the databases that they monitor.
Next steps
To install PMM and plan its network access, continue with these pages: